Citibank 2015 Annual Report Download - page 256
Download and view the complete annual report
Please find page 256 of the 2015 Citibank annual report below. You can navigate through the pages in the report by either clicking on the pages listed below, or by using the keyword search tool below to find specific information within the annual report.-
 1
1 -
2
-
3
-
4
-
5
-
6
-
7
-
8
-
9
-
10
-
11
-
12
-
13
-
14
-
15
-
16
-
17
-
18
-
19
-
20
-
21
-
22
-
23
-
24
-
25
-
26
-
27
-
28
-
29
-
30
-
31
-
32
-
33
-
34
-
35
-
36
-
37
-
38
-
39
-
40
-
41
-
42
-
43
-
44
-
45
-
46
-
47
-
48
-
49
-
50
-
51
-
52
-
53
-
54
-
55
-
56
-
57
-
58
-
59
-
60
-
61
-
62
-
63
-
64
-
65
-
66
-
67
-
68
-
69
-
70
-
71
-
72
-
73
-
74
-
75
-
76
-
77
-
78
-
79
-
80
-
81
-
82
-
83
-
84
-
85
-
86
-
87
-
88
-
89
-
90
-
91
-
92
-
93
-
94
-
95
-
96
-
97
-
98
-
99
-
100
-
101
-
102
-
103
-
104
-
105
-
106
-
107
-
108
-
109
-
110
-
111
-
112
-
113
-
114
-
115
-
116
-
117
-
118
-
119
-
120
-
121
-
122
-
123
-
124
-
125
-
126
-
127
-
128
-
129
-
130
-
131
-
132
-
133
-
134
-
135
-
136
-
137
-
138
-
139
-
140
-
141
-
142
-
143
-
144
-
145
-
146
-
147
-
148
-
149
-
150
-
151
-
152
-
153
-
154
-
155
-
156
-
157
-
158
-
159
-
160
-
161
-
162
-
163
-
164
-
165
-
166
-
167
-
168
-
169
-
170
-
171
-
172
-
173
-
174
-
175
-
176
-
177
-
178
-
179
-
180
-
181
-
182
-
183
-
184
-
185
-
186
-
187
-
188
-
189
-
190
-
191
-
192
-
193
-
194
-
195
-
196
-
197
-
198
-
199
-
200
-
201
-
202
-
203
-
204
-
205
-
206
-
207
-
208
-
209
-
210
-
211
-
212
-
213
-
214
-
215
-
216
-
217
-
218
-
219
-
220
-
221
-
222
-
223
-
224
-
225
-
226
-
227
-
228
-
229
-
230
-
231
-
232
-
233
-
234
-
235
-
236
-
237
-
238
-
239
-
240
-
241
-
242
-
243
-
244
-
245
-
 246
246 -
 247
247 -
 248
248 -
 249
249 -
 250
250 -
 251
251 -
 252
252 -
 253
253 -
 254
254 -
 255
255 -
 256
256 -
 257
257 -
 258
258 -
 259
259 -
 260
260 -
 261
261 -
 262
262 -
 263
263 -
 264
264 -
 265
265 -
 266
266 -
267
-
268
-
269
-
270
-
271
-
272
-
273
-
274
-
275
-
276
-
277
-
278
-
279
-
280
-
281
-
282
-
283
-
284
-
285
-
286
-
287
-
288
-
289
-
290
-
291
-
292
-
293
-
294
-
295
-
296
-
297
-
298
-
299
-
300
-
301
-
302
-
303
-
304
-
305
-
306
-
307
-
308
-
309
-
310
-
311
-
312
-
313
-
314
-
315
-
316
-
317
-
318
-
319
-
320
-
321
-
322
-
323
-
324
-
325
-
326
-
327
-
328
-
329
-
330
-
331
-
332
 |
 |

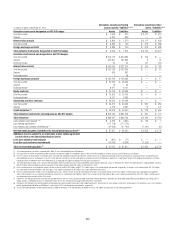
238
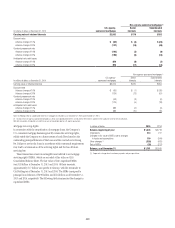
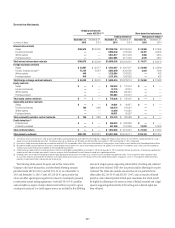
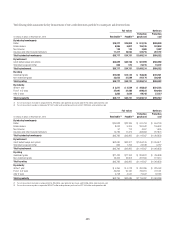
Derivative Mark-to-Market (MTM) Receivables/Payables
In millions of dollars at December 31, 2015
Derivatives classified in Trading
account assets / liabilities (1)(2)(3)
Derivatives classified in Other
assets / liabilities (2)(3)
Derivatives instruments designated as ASC 815 hedges Assets Liabilities Assets Liabilities
Over-the-counter $ 262 $ 105 $ 2,328 $ 106
Cleared 4,607 1,471 5 —
Interest rate contracts $ 4,869 $ 1,576 $ 2,333 $ 106
Over-the-counter $ 2,688 $ 364 $ 95 $ 677
Foreign exchange contracts $ 2,688 $ 364 $ 95 $ 677
Total derivative instruments designated as ASC 815 hedges $ 7,557 $ 1,940 $ 2,428 $ 783
Derivatives instruments not designated as ASC 815 hedges
Over-the-counter $ 289,124 $ 267,761 $ 182 $ 12
Cleared 120,848 126,532 244 216
Exchange traded 53 35 — —
Interest rate contracts $ 410,025 $ 394,328 $ 426 $ 228
Over-the-counter $ 126,474 $ 133,361 $ — $ 66
Cleared 134 152 — —
Exchange traded 21 36 — —
Foreign exchange contracts $ 126,629 $ 133,549 $ — $ 66
Over-the-counter $ 14,560 $ 20,107 $ — $ —
Cleared 28 3 — —
Exchange traded 7,297 6,406 — —
Equity contracts $ 21,885 $ 26,516 $ — $ —
Over-the-counter $ 16,794 $ 18,641 $ — $ —
Exchange traded 1,216 1,912 — —
Commodity and other contracts $ 18,010 $ 20,553 $ — $ —
Over-the-counter $ 31,072 $ 30,608 $ 711 $ 245
Cleared 3,803 3,560 131 318
Credit derivatives (4) $ 34,875 $ 34,168 $ 842 $ 563
Total derivatives instruments not designated as ASC 815 hedges $ 611,424 $ 609,114 $ 1,268 $ 857
Total derivatives $ 618,981 $ 611,054 $ 3,696 $ 1,640
Cash collateral paid/received (5)(6) $ 4,911 $ 13,628 $ 8 $ 37
Less: Netting agreements (7) (524,481) (524,481) — —
Less: Netting cash collateral received/paid (8) (43,227) (42,609) (1,949) (53)
Net receivables/payables included on the Consolidated Balance Sheet (9) $ 56,184 $ 57,592 $ 1,755 $1,624
Additional amounts subject to an enforceable master netting agreement but not offset on
the Consolidated Balance Sheet
Less: Cash collateral received/paid $ (779) $ (2) $ — $ —
Less: Non-cash collateral received/paid (9,855) (5,131) (270) —
Total net receivables/payables (9) $ 45,550 $ 52,459 $ 1,485 $1,624
(1) The trading derivatives fair values are presented in Note 13 to the Consolidated Financial Statements.
(2) Derivative mark-to-market receivables/payables related to management hedges are recorded in either Other assets/Other liabilities or Trading account assets/Trading account liabilities.
(3) Over-the-counter (OTC) derivatives are derivatives executed and settled bilaterally with counterparties without the use of an organized exchange or central clearing house. Cleared derivatives include derivatives
executed bilaterally with a counterparty in the OTC market but then novated to a central clearing house, whereby the central clearing house becomes the counterparty to both of the original counterparties. Exchange
traded derivatives include derivatives executed directly on an organized exchange that provides pre-trade price transparency.
(4) The credit derivatives trading assets comprise $17,957 million related to protection purchased and $16,918 million related to protection sold as of December 31, 2015. The credit derivatives trading liabilities comprise
$16,968 million related to protection purchased and $17,200 million related to protection sold as of December 31, 2015.
(5) For the trading account assets/liabilities, reflects the net amount of the $47,520 million and $56,855 million of gross cash collateral paid and received, respectively. Of the gross cash collateral paid, $42,609 million
was used to offset trading derivative liabilities and, of the gross cash collateral received, $43,227 million was used to offset trading derivative assets.
(6) For cash collateral paid with respect to non-trading derivative assets, reflects the net amount of $61 million of gross cash collateral paid, of which $53 million is netted against non-trading derivative positions within
Other liabilities. For cash collateral received with respect to non-trading derivative liabilities, reflects the net amount of $1,986 million of gross cash collateral received, of which $1,949 million is netted against OTC
non-trading derivative positions within Other assets.
(7) Represents the netting of derivative receivable and payable balances with the same counterparty under enforceable netting agreements. Approximately $391 billion, $126 billion and $7 billion of the netting against
trading account asset/liability balances is attributable to each of the OTC, cleared and exchange-traded derivatives, respectively.
(8) Represents the netting of cash collateral paid and received by counterparty under enforceable credit support agreements. Substantially all cash collateral received and paid is netted against OTC derivative assets and
liabilities, respectively.
(9) The net receivables/payables include approximately $10 billion of derivative asset and $10 billion of derivative liability fair values not subject to enforceable master netting agreements, respectively.