Citibank 2015 Annual Report Download - page 263
Download and view the complete annual report
Please find page 263 of the 2015 Citibank annual report below. You can navigate through the pages in the report by either clicking on the pages listed below, or by using the keyword search tool below to find specific information within the annual report.-
 1
1 -
2
-
3
-
4
-
5
-
6
-
7
-
8
-
9
-
10
-
11
-
12
-
13
-
14
-
15
-
16
-
17
-
18
-
19
-
20
-
21
-
22
-
23
-
24
-
25
-
26
-
27
-
28
-
29
-
30
-
31
-
32
-
33
-
34
-
35
-
36
-
37
-
38
-
39
-
40
-
41
-
42
-
43
-
44
-
45
-
46
-
47
-
48
-
49
-
50
-
51
-
52
-
53
-
54
-
55
-
56
-
57
-
58
-
59
-
60
-
61
-
62
-
63
-
64
-
65
-
66
-
67
-
68
-
69
-
70
-
71
-
72
-
73
-
74
-
75
-
76
-
77
-
78
-
79
-
80
-
81
-
82
-
83
-
84
-
85
-
86
-
87
-
88
-
89
-
90
-
91
-
92
-
93
-
94
-
95
-
96
-
97
-
98
-
99
-
100
-
101
-
102
-
103
-
104
-
105
-
106
-
107
-
108
-
109
-
110
-
111
-
112
-
113
-
114
-
115
-
116
-
117
-
118
-
119
-
120
-
121
-
122
-
123
-
124
-
125
-
126
-
127
-
128
-
129
-
130
-
131
-
132
-
133
-
134
-
135
-
136
-
137
-
138
-
139
-
140
-
141
-
142
-
143
-
144
-
145
-
146
-
147
-
148
-
149
-
150
-
151
-
152
-
153
-
154
-
155
-
156
-
157
-
158
-
159
-
160
-
161
-
162
-
163
-
164
-
165
-
166
-
167
-
168
-
169
-
170
-
171
-
172
-
173
-
174
-
175
-
176
-
177
-
178
-
179
-
180
-
181
-
182
-
183
-
184
-
185
-
186
-
187
-
188
-
189
-
190
-
191
-
192
-
193
-
194
-
195
-
196
-
197
-
198
-
199
-
200
-
201
-
202
-
203
-
204
-
205
-
206
-
207
-
208
-
209
-
210
-
211
-
212
-
213
-
214
-
215
-
216
-
217
-
218
-
219
-
220
-
221
-
222
-
223
-
224
-
225
-
226
-
227
-
228
-
229
-
230
-
231
-
232
-
233
-
234
-
235
-
236
-
237
-
238
-
239
-
240
-
241
-
242
-
243
-
244
-
245
-
246
-
247
-
248
-
249
-
250
-
251
-
252
-
 253
253 -
 254
254 -
 255
255 -
 256
256 -
 257
257 -
 258
258 -
 259
259 -
 260
260 -
 261
261 -
 262
262 -
 263
263 -
 264
264 -
 265
265 -
 266
266 -
 267
267 -
 268
268 -
 269
269 -
 270
270 -
 271
271 -
 272
272 -
 273
273 -
274
-
275
-
276
-
277
-
278
-
279
-
280
-
281
-
282
-
283
-
284
-
285
-
286
-
287
-
288
-
289
-
290
-
291
-
292
-
293
-
294
-
295
-
296
-
297
-
298
-
299
-
300
-
301
-
302
-
303
-
304
-
305
-
306
-
307
-
308
-
309
-
310
-
311
-
312
-
313
-
314
-
315
-
316
-
317
-
318
-
319
-
320
-
321
-
322
-
323
-
324
-
325
-
326
-
327
-
328
-
329
-
330
-
331
-
332
 |
 |

245
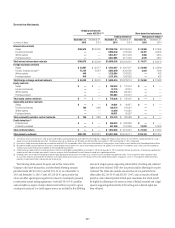
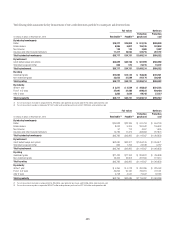
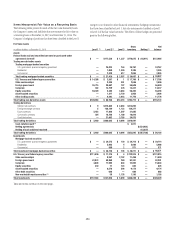
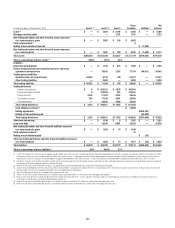
The following tables summarize the key characteristics of Citi’s credit derivatives portfolio by counterparty and derivative form:
Fair values Notionals
In millions of dollars at December 31, 2015 Receivable (1) Payable (2)
Protection
purchased
Protection
sold
By industry/counterparty
Banks $18,377 $16,988 $ 513,335 $508,459
Broker-dealers 5,895 6,697 155,195 152,604
Non-financial 128 123 3,969 2,087
Insurance and other financial institutions 11,317 10,923 332,715 287,772
Total by industry/counterparty $35,717 $34,731 $1,005,214 $950,922
By instrument
Credit default swaps and options $34,849 $34,158 $ 981,999 $940,650
Total return swaps and other 868 573 23,215 10,272
Total by instrument $35,717 $34,731 $1,005,214 $950,922
By rating
Investment grade $12,694 $13,142 $ 764,040 $720,521
Non-investment grade 23,023 21,589 241,174 230,401
Total by rating $35,717 $34,731 $1,005,214 $950,922
By maturity
Within 1 year $ 3,871 $ 3,559 $ 265,632 $254,225
From 1 to 5 years 27,991 27,488 669,834 639,460
After 5 years 3,855 3,684 69,748 57,237
Total by maturity $35,717 $34,731 $1,005,214 $950,922
(1) The fair value amount receivable is composed of $18,799 million under protection purchased and $16,918 million under protection sold.
(2) The fair value amount payable is composed of $17,531 million under protection purchased and $17,200 million under protection sold.
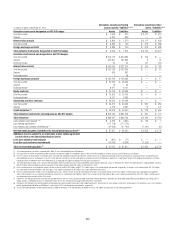
Fair values Notionals
In millions of dollars at December 31, 2014 Receivable (1) Payable (2)
Protection
purchased
Protection
sold
By industry/counterparty
Banks $24,828 $23,189 $ 574,764 $ 604,700
Broker-dealers 8,093 9,309 204,542 199,693
Non-financial 91 113 3,697 1,595
Insurance and other financial institutions 10,784 11,374 333,384 257,870
Total by industry/counterparty $43,796 $43,985 $1,116,387 $1,063,858
By instrument
Credit default swaps and options $42,930 $42,201 $1,094,199 $1,054,671
Total return swaps and other 866 1,784 22,188 9,187
Total by instrument $43,796 $43,985 $1,116,387 $1,063,858
By rating
Investment grade $17,432 $17,182 $ 824,831 $ 786,848
Non-investment grade 26,364 26,803 291,556 277,010
Total by rating $43,796 $43,985 $1,116,387 $1,063,858
By maturity
Within 1 year $ 4,356 $ 4,278 $ 250,489 $ 229,502
From 1 to 5 years 34,692 35,160 790,251 772,001
After 5 years 4,748 4,547 75,647 62,355
Total by maturity $43,796 $43,985 $1,116,387 $1,063,858
(1) The fair value amount receivable is composed of $18,708 million under protection purchased and $25,088 million under protection sold.
(2) The fair value amount payable is composed of $26,527 million under protection purchased and $17,458 million under protection sold.