Citibank 2015 Annual Report Download - page 90
Download and view the complete annual report
Please find page 90 of the 2015 Citibank annual report below. You can navigate through the pages in the report by either clicking on the pages listed below, or by using the keyword search tool below to find specific information within the annual report.-
 1
1 -
2
-
3
-
4
-
5
-
6
-
7
-
8
-
9
-
10
-
11
-
12
-
13
-
14
-
15
-
16
-
17
-
18
-
19
-
20
-
21
-
22
-
23
-
24
-
25
-
26
-
27
-
28
-
29
-
30
-
31
-
32
-
33
-
34
-
35
-
36
-
37
-
38
-
39
-
40
-
41
-
42
-
43
-
44
-
45
-
46
-
47
-
48
-
49
-
50
-
51
-
52
-
53
-
54
-
55
-
56
-
57
-
58
-
59
-
60
-
61
-
62
-
63
-
64
-
65
-
66
-
67
-
68
-
69
-
70
-
71
-
72
-
73
-
74
-
75
-
76
-
77
-
78
-
79
-
 80
80 -
 81
81 -
 82
82 -
 83
83 -
 84
84 -
 85
85 -
 86
86 -
 87
87 -
 88
88 -
 89
89 -
 90
90 -
 91
91 -
 92
92 -
 93
93 -
 94
94 -
 95
95 -
 96
96 -
 97
97 -
 98
98 -
 99
99 -
 100
100 -
101
-
102
-
103
-
104
-
105
-
106
-
107
-
108
-
109
-
110
-
111
-
112
-
113
-
114
-
115
-
116
-
117
-
118
-
119
-
120
-
121
-
122
-
123
-
124
-
125
-
126
-
127
-
128
-
129
-
130
-
131
-
132
-
133
-
134
-
135
-
136
-
137
-
138
-
139
-
140
-
141
-
142
-
143
-
144
-
145
-
146
-
147
-
148
-
149
-
150
-
151
-
152
-
153
-
154
-
155
-
156
-
157
-
158
-
159
-
160
-
161
-
162
-
163
-
164
-
165
-
166
-
167
-
168
-
169
-
170
-
171
-
172
-
173
-
174
-
175
-
176
-
177
-
178
-
179
-
180
-
181
-
182
-
183
-
184
-
185
-
186
-
187
-
188
-
189
-
190
-
191
-
192
-
193
-
194
-
195
-
196
-
197
-
198
-
199
-
200
-
201
-
202
-
203
-
204
-
205
-
206
-
207
-
208
-
209
-
210
-
211
-
212
-
213
-
214
-
215
-
216
-
217
-
218
-
219
-
220
-
221
-
222
-
223
-
224
-
225
-
226
-
227
-
228
-
229
-
230
-
231
-
232
-
233
-
234
-
235
-
236
-
237
-
238
-
239
-
240
-
241
-
242
-
243
-
244
-
245
-
246
-
247
-
248
-
249
-
250
-
251
-
252
-
253
-
254
-
255
-
256
-
257
-
258
-
259
-
260
-
261
-
262
-
263
-
264
-
265
-
266
-
267
-
268
-
269
-
270
-
271
-
272
-
273
-
274
-
275
-
276
-
277
-
278
-
279
-
280
-
281
-
282
-
283
-
284
-
285
-
286
-
287
-
288
-
289
-
290
-
291
-
292
-
293
-
294
-
295
-
296
-
297
-
298
-
299
-
300
-
301
-
302
-
303
-
304
-
305
-
306
-
307
-
308
-
309
-
310
-
311
-
312
-
313
-
314
-
315
-
316
-
317
-
318
-
319
-
320
-
321
-
322
-
323
-
324
-
325
-
326
-
327
-
328
-
329
-
330
-
331
-
332
 |
 |

72
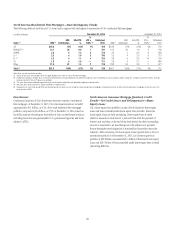
Approximately 6.7% of the Revolving HELOCs that have begun
amortization as of December 31, 2015 were 30+ days past due, compared
to 3.2% of the total outstanding home equity loan portfolio (amortizing
and non-amortizing). This compared to 6.4% and 2.7%, respectively, as
of December 31, 2014. As newly amortizing loans continue to season, the
delinquency rate of the amortizing Revolving HELOC portfolio and total
home equity loan portfolio is expected to continue to increase. In addition,
resets to date have generally occurred during a period of historically low
interest rates, which Citi believes has likely reduced the overall “payment
shock” to the borrower.
Citi continues to monitor this reset risk closely and will continue to
consider any potential impact in determining its allowance for loan loss
reserves. In addition, management continues to review and take additional
actions to offset potential reset risk, such as a borrower outreach program to
provide reset risk education and proactively working with high-risk borrowers
through a specialized single point of contact unit. For further information on
reset risk, see “Risk Factors—Credit and Market Risks” above.
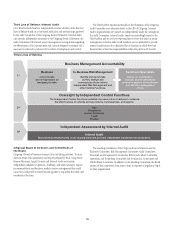
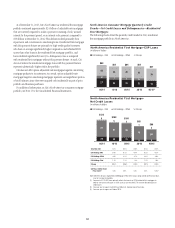
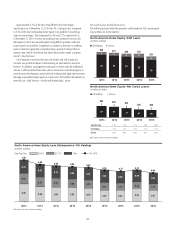
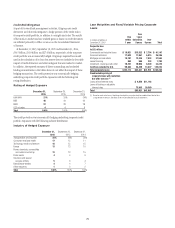
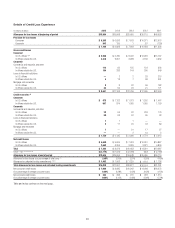
Net Credit Losses and Delinquencies
The following charts detail the quarterly credit trends for Citi’s home equity
loan portfolio in North America:
4Q’153Q’152Q’151Q’154Q’14
25 24 23 22
19
North America Home Equity
—EOP Loans
In billions of dollars
Citi Holdings Citicorp
$28 $27 $26
$23
$25
3334
4
4Q’153Q’152Q’151Q’154Q’14
87
1
81
2
71
2
61
1
56
2
North America Home Equity—Net Credit Losses
In millions of dollars
Citi Holdings Citicorp
$88 $83 $72 $58
$62
Total NCL Rate 1.2% 1.2% 1.1% 1.0% 0.9%
Citi Holdings 1.4% 1.3% 1.2% 1.1% 1.1%
Citicorp 0.2% 0.2% 0.2% 0.1% 0.2%
Note: Totals may not sum due to rounding.
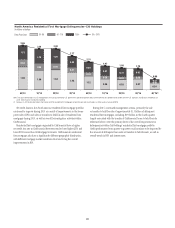
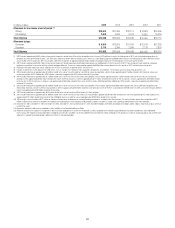
North America Home Equity Loan Delinquencies—Citi Holdings
In billions of dollars
Days Past Due: 30+ DPD180+90-17930-89
4Q’153Q’152Q’151Q’154Q’143Q’142Q’141Q’144Q’13
0.42 0.35 0.34 0.33 0.32 0.27 0.27 0.31 0.27
0.25
0.23 0.21 0.20 0.19 0.18 0.16 0.16 0.15
0.33
0.32 0.31 0.30 0.31 0.31 0.30 0.27
0.29
1.00
0.89 0.85 0.84 0.82
0.75 0.73 0.75 0.69
Note: Totals may not sum due to rounding.