Citibank 2015 Annual Report Download - page 189
Download and view the complete annual report
Please find page 189 of the 2015 Citibank annual report below. You can navigate through the pages in the report by either clicking on the pages listed below, or by using the keyword search tool below to find specific information within the annual report.-
 1
1 -
2
-
3
-
4
-
5
-
6
-
7
-
8
-
9
-
10
-
11
-
12
-
13
-
14
-
15
-
16
-
17
-
18
-
19
-
20
-
21
-
22
-
23
-
24
-
25
-
26
-
27
-
28
-
29
-
30
-
31
-
32
-
33
-
34
-
35
-
36
-
37
-
38
-
39
-
40
-
41
-
42
-
43
-
44
-
45
-
46
-
47
-
48
-
49
-
50
-
51
-
52
-
53
-
54
-
55
-
56
-
57
-
58
-
59
-
60
-
61
-
62
-
63
-
64
-
65
-
66
-
67
-
68
-
69
-
70
-
71
-
72
-
73
-
74
-
75
-
76
-
77
-
78
-
79
-
80
-
81
-
82
-
83
-
84
-
85
-
86
-
87
-
88
-
89
-
90
-
91
-
92
-
93
-
94
-
95
-
96
-
97
-
98
-
99
-
100
-
101
-
102
-
103
-
104
-
105
-
106
-
107
-
108
-
109
-
110
-
111
-
112
-
113
-
114
-
115
-
116
-
117
-
118
-
119
-
120
-
121
-
122
-
123
-
124
-
125
-
126
-
127
-
128
-
129
-
130
-
131
-
132
-
133
-
134
-
135
-
136
-
137
-
138
-
139
-
140
-
141
-
142
-
143
-
144
-
145
-
146
-
147
-
148
-
149
-
150
-
151
-
152
-
153
-
154
-
155
-
156
-
157
-
158
-
159
-
160
-
161
-
162
-
163
-
164
-
165
-
166
-
167
-
168
-
169
-
170
-
171
-
172
-
173
-
174
-
175
-
176
-
177
-
178
-
 179
179 -
 180
180 -
 181
181 -
 182
182 -
 183
183 -
 184
184 -
 185
185 -
 186
186 -
 187
187 -
 188
188 -
 189
189 -
 190
190 -
 191
191 -
 192
192 -
 193
193 -
 194
194 -
 195
195 -
 196
196 -
 197
197 -
 198
198 -
 199
199 -
200
-
201
-
202
-
203
-
204
-
205
-
206
-
207
-
208
-
209
-
210
-
211
-
212
-
213
-
214
-
215
-
216
-
217
-
218
-
219
-
220
-
221
-
222
-
223
-
224
-
225
-
226
-
227
-
228
-
229
-
230
-
231
-
232
-
233
-
234
-
235
-
236
-
237
-
238
-
239
-
240
-
241
-
242
-
243
-
244
-
245
-
246
-
247
-
248
-
249
-
250
-
251
-
252
-
253
-
254
-
255
-
256
-
257
-
258
-
259
-
260
-
261
-
262
-
263
-
264
-
265
-
266
-
267
-
268
-
269
-
270
-
271
-
272
-
273
-
274
-
275
-
276
-
277
-
278
-
279
-
280
-
281
-
282
-
283
-
284
-
285
-
286
-
287
-
288
-
289
-
290
-
291
-
292
-
293
-
294
-
295
-
296
-
297
-
298
-
299
-
300
-
301
-
302
-
303
-
304
-
305
-
306
-
307
-
308
-
309
-
310
-
311
-
312
-
313
-
314
-
315
-
316
-
317
-
318
-
319
-
320
-
321
-
322
-
323
-
324
-
325
-
326
-
327
-
328
-
329
-
330
-
331
-
332
 |
 |

171
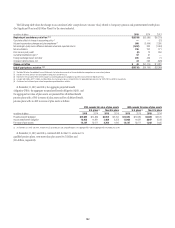
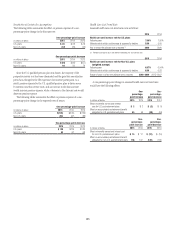
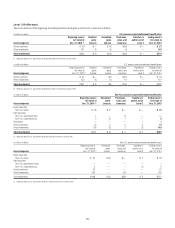
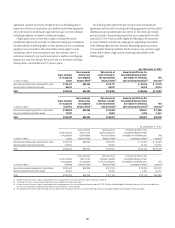
Level 3 Rollforward
The reconciliations of the beginning and ending balances during the year for Level 3 assets are as follows:
In millions of dollars U.S. pension and postretirement benefit plans
Asset categories
Beginning Level 3
fair value at
Dec. 31, 2014 (1)
Realized
gains
(losses)
Unrealized
gains
(losses)
Purchases,
sales, and
issuances
Transfers in
and/or out of
Level 3
Ending Level 3
fair value at
Dec. 31, 2015
Annuity contracts $ 59 $— $ (4) $(28) $— $ 27
Other investments 161 (1) (9) (4) — 147
Total investments $ 220 $ (1) $(13) $(32) $— $ 174
(1) Beginning balance was adjusted to exclude $2,496 million of investments valued at NAV.
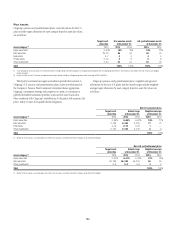
In millions of dollars U.S. pension and postretirement benefit plans
Asset categories
Beginning Level 3
fair value at
Dec. 31, 2013 (1)
Realized
gains
(losses)
Unrealized
gains
(losses)
Purchases,
sales, and
issuances
Transfers in
and/or out of
Level 3
Ending Level 3
fair value at
Dec. 31, 2014
Annuity contracts $ 91 $— $(1) $(31) $— $ 59
Other investments 150 (1) (4) 16 — 161
Total investments $ 241 $ (1) $(5) $(15) $— $ 220
(1) Beginning balance was adjusted to exclude $3,284 million of investments valued at NAV.
In millions of dollars Non-U.S. pension and postretirement benefit plans
Asset categories
Beginning Level 3
fair value at
Dec. 31, 2014 (1)
Unrealized
gains
(losses)
Purchases,
sales, and
issuances
Transfers in
and/or out of
Level 3
Ending Level 3
fair value at
Dec. 31, 2015
Equity securities
Non-U.S. equity $ 48 $ (1) $— $— $ 47
Debt securities
Non-U.S. government debt 1 — (1) — —
Non-U.S. corporate bonds 5 (1) 1 — 5
Real estate — — — 1 1
Annuity contracts 32 2 4 3 41
Other investments 165 (2) 2 (2) 163
Total investments $ 251 $ (2) $ 6 $ 2 $ 257
(1) Beginning balance was adjusted to exclude $5 million of investments valued at NAV.
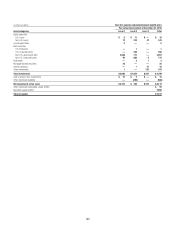
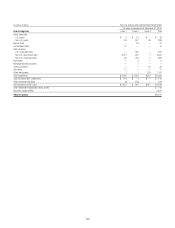
In millions of dollars Non-U.S. pension and postretirement benefit plans
Asset categories
Beginning Level 3
fair value at
Dec. 31, 2013 (1)
Unrealized
gains
(losses)
Purchases,
sales, and
issuances
Transfers in
and/or out of
Level 3
Ending Level 3
fair value at
Dec. 31, 2014
Equity securities
Non-U.S. equity $ 49 $ (3) $ — $ 2 $ 48
Debt securities
Non-U.S. government bonds — — — 1 1
Non-U.S. corporate bonds 5 — 1 (1) 5
Annuity contracts 32 — — — 32
Other investments 202 — (37) — 165
Total investments $ 288 $ (3) $(36) $ 2 $ 251
(1) Beginning balance was adjusted to exclude $11 million of investments valued at NAV.