Citibank 2015 Annual Report Download - page 274
Download and view the complete annual report
Please find page 274 of the 2015 Citibank annual report below. You can navigate through the pages in the report by either clicking on the pages listed below, or by using the keyword search tool below to find specific information within the annual report.-
 1
1 -
2
-
3
-
4
-
5
-
6
-
7
-
8
-
9
-
10
-
11
-
12
-
13
-
14
-
15
-
16
-
17
-
18
-
19
-
20
-
21
-
22
-
23
-
24
-
25
-
26
-
27
-
28
-
29
-
30
-
31
-
32
-
33
-
34
-
35
-
36
-
37
-
38
-
39
-
40
-
41
-
42
-
43
-
44
-
45
-
46
-
47
-
48
-
49
-
50
-
51
-
52
-
53
-
54
-
55
-
56
-
57
-
58
-
59
-
60
-
61
-
62
-
63
-
64
-
65
-
66
-
67
-
68
-
69
-
70
-
71
-
72
-
73
-
74
-
75
-
76
-
77
-
78
-
79
-
80
-
81
-
82
-
83
-
84
-
85
-
86
-
87
-
88
-
89
-
90
-
91
-
92
-
93
-
94
-
95
-
96
-
97
-
98
-
99
-
100
-
101
-
102
-
103
-
104
-
105
-
106
-
107
-
108
-
109
-
110
-
111
-
112
-
113
-
114
-
115
-
116
-
117
-
118
-
119
-
120
-
121
-
122
-
123
-
124
-
125
-
126
-
127
-
128
-
129
-
130
-
131
-
132
-
133
-
134
-
135
-
136
-
137
-
138
-
139
-
140
-
141
-
142
-
143
-
144
-
145
-
146
-
147
-
148
-
149
-
150
-
151
-
152
-
153
-
154
-
155
-
156
-
157
-
158
-
159
-
160
-
161
-
162
-
163
-
164
-
165
-
166
-
167
-
168
-
169
-
170
-
171
-
172
-
173
-
174
-
175
-
176
-
177
-
178
-
179
-
180
-
181
-
182
-
183
-
184
-
185
-
186
-
187
-
188
-
189
-
190
-
191
-
192
-
193
-
194
-
195
-
196
-
197
-
198
-
199
-
200
-
201
-
202
-
203
-
204
-
205
-
206
-
207
-
208
-
209
-
210
-
211
-
212
-
213
-
214
-
215
-
216
-
217
-
218
-
219
-
220
-
221
-
222
-
223
-
224
-
225
-
226
-
227
-
228
-
229
-
230
-
231
-
232
-
233
-
234
-
235
-
236
-
237
-
238
-
239
-
240
-
241
-
242
-
243
-
244
-
245
-
246
-
247
-
248
-
249
-
250
-
251
-
252
-
253
-
254
-
255
-
256
-
257
-
258
-
259
-
260
-
261
-
262
-
263
-
 264
264 -
 265
265 -
 266
266 -
 267
267 -
 268
268 -
 269
269 -
 270
270 -
 271
271 -
 272
272 -
 273
273 -
 274
274 -
 275
275 -
 276
276 -
 277
277 -
 278
278 -
 279
279 -
 280
280 -
 281
281 -
 282
282 -
 283
283 -
 284
284 -
285
-
286
-
287
-
288
-
289
-
290
-
291
-
292
-
293
-
294
-
295
-
296
-
297
-
298
-
299
-
300
-
301
-
302
-
303
-
304
-
305
-
306
-
307
-
308
-
309
-
310
-
311
-
312
-
313
-
314
-
315
-
316
-
317
-
318
-
319
-
320
-
321
-
322
-
323
-
324
-
325
-
326
-
327
-
328
-
329
-
330
-
331
-
332
 |
 |

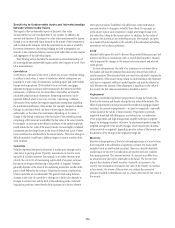
256
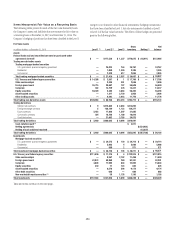
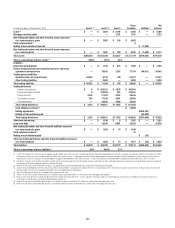
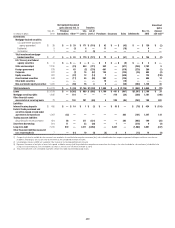
Fair Value Levels
In millions of dollars at December 31, 2014 Level 1 (1) Level 2 (1) Level 3
Gross
inventory Netting (2)
Net
balance
Assets
Federal funds sold and securities borrowed or purchased under
agreements to resell $ — $187,922 $ 3,398 $191,320 $ (47,129) $144,191
Trading non-derivative assets
Trading mortgage-backed securities
U.S. government-sponsored agency guaranteed — 25,968 1,085 27,053 — 27,053
Residential — 2,158 2,680 4,838 — 4,838
Commercial — 3,903 440 4,343 — 4,343
Total trading mortgage-backed securities $ — $ 32,029 $ 4,205 $ 36,234 $ — $ 36,234
U.S. Treasury and federal agency securities $ 15,991 $ 4,483 $ — $ 20,474 $ — $ 20,474
State and municipal — 3,161 241 3,402 — 3,402
Foreign government 37,995 26,736 206 64,937 — 64,937
Corporate 1,337 25,640 820 27,797 — 27,797
Equity securities 51,346 4,281 2,219 57,846 — 57,846
Asset-backed securities — 1,252 3,294 4,546 — 4,546
Other trading assets — 9,221 4,372 13,593 — 13,593
Total trading non-derivative assets $106,669 $106,803 $15,357 $228,829 $ — $228,829
Trading derivatives
Interest rate contracts $ 74 $634,318 $ 4,061 $638,453
Foreign exchange contracts — 154,744 1,250 155,994
Equity contracts 2,748 19,969 2,035 24,752
Commodity contracts 647 21,850 1,023 23,520
Credit derivatives — 40,618 2,900 43,518
Total trading derivatives $ 3,469 $871,499 $11,269 $886,237
Cash collateral paid (3) $ 6,523
Netting agreements $ (777,178)
Netting of cash collateral received (4)(8) (47,625)
Total trading derivatives $ 3,469 $871,499 $11,269 $892,760 $ (824,803) $ 67,957
Investments
Mortgage-backed securities
U.S. government-sponsored agency guaranteed $ — $ 36,053 $ 38 $ 36,091 $ — $ 36,091
Residential — 8,355 8 8,363 — 8,363
Commercial — 553 1 554 — 554
Total investment mortgage-backed securities $ — $ 44,961 $ 47 $ 45,008 $ — $ 45,008
U.S. Treasury and federal agency securities $110,710 $ 12,974 $ 6 $123,690 $ — $123,690
State and municipal — 10,519 2,180 12,699 — 12,699
Foreign government 37,280 52,739 678 90,697 — 90,697
Corporate 1,739 9,746 672 12,157 — 12,157
Equity securities 1,770 274 681 2,725 — 2,725
Asset-backed securities — 11,957 549 12,506 — 12,506
Other debt securities — 661 — 661 — 661
Non-marketable equity securities (5) — 233 1,460 1,693 — 1,693
Total investments $151,499 $144,064 $ 6,273 $301,836 $ — $301,836
Table and notes continue on the next page.