Citibank 2015 Annual Report Download - page 225
Download and view the complete annual report
Please find page 225 of the 2015 Citibank annual report below. You can navigate through the pages in the report by either clicking on the pages listed below, or by using the keyword search tool below to find specific information within the annual report.-
 1
1 -
2
-
3
-
4
-
5
-
6
-
7
-
8
-
9
-
10
-
11
-
12
-
13
-
14
-
15
-
16
-
17
-
18
-
19
-
20
-
21
-
22
-
23
-
24
-
25
-
26
-
27
-
28
-
29
-
30
-
31
-
32
-
33
-
34
-
35
-
36
-
37
-
38
-
39
-
40
-
41
-
42
-
43
-
44
-
45
-
46
-
47
-
48
-
49
-
50
-
51
-
52
-
53
-
54
-
55
-
56
-
57
-
58
-
59
-
60
-
61
-
62
-
63
-
64
-
65
-
66
-
67
-
68
-
69
-
70
-
71
-
72
-
73
-
74
-
75
-
76
-
77
-
78
-
79
-
80
-
81
-
82
-
83
-
84
-
85
-
86
-
87
-
88
-
89
-
90
-
91
-
92
-
93
-
94
-
95
-
96
-
97
-
98
-
99
-
100
-
101
-
102
-
103
-
104
-
105
-
106
-
107
-
108
-
109
-
110
-
111
-
112
-
113
-
114
-
115
-
116
-
117
-
118
-
119
-
120
-
121
-
122
-
123
-
124
-
125
-
126
-
127
-
128
-
129
-
130
-
131
-
132
-
133
-
134
-
135
-
136
-
137
-
138
-
139
-
140
-
141
-
142
-
143
-
144
-
145
-
146
-
147
-
148
-
149
-
150
-
151
-
152
-
153
-
154
-
155
-
156
-
157
-
158
-
159
-
160
-
161
-
162
-
163
-
164
-
165
-
166
-
167
-
168
-
169
-
170
-
171
-
172
-
173
-
174
-
175
-
176
-
177
-
178
-
179
-
180
-
181
-
182
-
183
-
184
-
185
-
186
-
187
-
188
-
189
-
190
-
191
-
192
-
193
-
194
-
195
-
196
-
197
-
198
-
199
-
200
-
201
-
202
-
203
-
204
-
205
-
206
-
207
-
208
-
209
-
210
-
211
-
212
-
213
-
214
-
 215
215 -
 216
216 -
 217
217 -
 218
218 -
 219
219 -
 220
220 -
 221
221 -
 222
222 -
 223
223 -
 224
224 -
 225
225 -
 226
226 -
 227
227 -
 228
228 -
 229
229 -
 230
230 -
 231
231 -
 232
232 -
 233
233 -
 234
234 -
 235
235 -
236
-
237
-
238
-
239
-
240
-
241
-
242
-
243
-
244
-
245
-
246
-
247
-
248
-
249
-
250
-
251
-
252
-
253
-
254
-
255
-
256
-
257
-
258
-
259
-
260
-
261
-
262
-
263
-
264
-
265
-
266
-
267
-
268
-
269
-
270
-
271
-
272
-
273
-
274
-
275
-
276
-
277
-
278
-
279
-
280
-
281
-
282
-
283
-
284
-
285
-
286
-
287
-
288
-
289
-
290
-
291
-
292
-
293
-
294
-
295
-
296
-
297
-
298
-
299
-
300
-
301
-
302
-
303
-
304
-
305
-
306
-
307
-
308
-
309
-
310
-
311
-
312
-
313
-
314
-
315
-
316
-
317
-
318
-
319
-
320
-
321
-
322
-
323
-
324
-
325
-
326
-
327
-
328
-
329
-
330
-
331
-
332
 |
 |

207
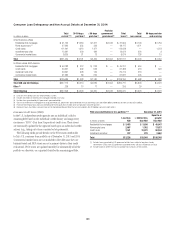
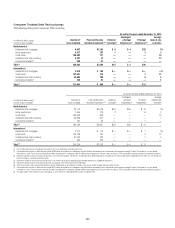
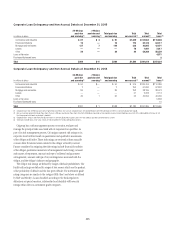
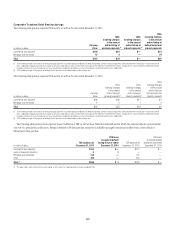
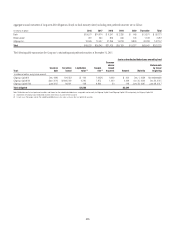
The following tables present non-accrual loan information by corporate loan type and interest income recognized on non-accrual corporate loans:
Non-Accrual Corporate Loans
At and for the year ended December 31, 2015
In millions of dollars
Recorded
investment (1)
Unpaid
principal balance
Related specific
allowance
Average
carrying value (2)
Interest income
recognized (3)
Non-accrual corporate loans
Commercial and industrial $1,039 $1,224 $246 $ 825 $ 7
Financial institutions 173 196 10 194 —
Mortgage and real estate 232 336 21 240 4
Lease financing 76 76 54 62 —
Other 44 114 32 39 —
Total non-accrual corporate loans $1,564 $1,946 $363 $1,360 $11
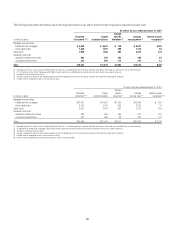
At and for the year ended December 31, 2014
In millions of dollars
Recorded
investment (1)
Unpaid
principal balance
Related specific
allowance
Average
carrying value (2)
Interest income
recognized (3)
Non-accrual corporate loans
Commercial and industrial $ 575 $ 863 $155 $ 658 $32
Financial institutions 250 262 7 278 4
Mortgage and real estate 252 287 24 263 8
Lease financing 51 53 29 85 —
Other 55 68 21 60 3
Total non-accrual corporate loans $ 1,183 $1,533 $236 $1,344 $47
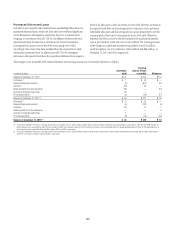
December 31, 2015 December 31, 2014
In millions of dollars
Recorded
investment (1)
Related specific
allowance
Recorded
investment (1)
Related specific
allowance
Non-accrual corporate loans with valuation allowances
Commercial and industrial $539 $246 $224 $155
Financial institutions 18 10 37 7
Mortgage and real estate 60 21 70 24
Lease financing 75 54 47 29
Other 40 32 55 21
Total non-accrual corporate loans with specific allowance $732 $363 $433 $236
Non-accrual corporate loans without specific allowance
Commercial and industrial $500 $351
Financial institutions 155 213
Mortgage and real estate 172 182
Lease financing 14
Other 4—
Total non-accrual corporate loans without specific allowance $832 N/A $750 N/A
(1) Recorded investment in a loan includes net deferred loan fees and costs, unamortized premium or discount, less any direct write-downs.
(2) Average carrying value represents the average recorded investment balance and does not include related specific allowance.
(3) Interest income recognized for the year ended December 31, 2013 was $43 million.
N/A Not Applicable