Citibank 2015 Annual Report Download - page 112
Download and view the complete annual report
Please find page 112 of the 2015 Citibank annual report below. You can navigate through the pages in the report by either clicking on the pages listed below, or by using the keyword search tool below to find specific information within the annual report.-
 1
1 -
2
-
3
-
4
-
5
-
6
-
7
-
8
-
9
-
10
-
11
-
12
-
13
-
14
-
15
-
16
-
17
-
18
-
19
-
20
-
21
-
22
-
23
-
24
-
25
-
26
-
27
-
28
-
29
-
30
-
31
-
32
-
33
-
34
-
35
-
36
-
37
-
38
-
39
-
40
-
41
-
42
-
43
-
44
-
45
-
46
-
47
-
48
-
49
-
50
-
51
-
52
-
53
-
54
-
55
-
56
-
57
-
58
-
59
-
60
-
61
-
62
-
63
-
64
-
65
-
66
-
67
-
68
-
69
-
70
-
71
-
72
-
73
-
74
-
75
-
76
-
77
-
78
-
79
-
80
-
81
-
82
-
83
-
84
-
85
-
86
-
87
-
88
-
89
-
90
-
91
-
92
-
93
-
94
-
95
-
96
-
97
-
98
-
99
-
100
-
101
-
 102
102 -
 103
103 -
 104
104 -
 105
105 -
 106
106 -
 107
107 -
 108
108 -
 109
109 -
 110
110 -
 111
111 -
 112
112 -
 113
113 -
 114
114 -
 115
115 -
 116
116 -
 117
117 -
 118
118 -
 119
119 -
 120
120 -
 121
121 -
 122
122 -
123
-
124
-
125
-
126
-
127
-
128
-
129
-
130
-
131
-
132
-
133
-
134
-
135
-
136
-
137
-
138
-
139
-
140
-
141
-
142
-
143
-
144
-
145
-
146
-
147
-
148
-
149
-
150
-
151
-
152
-
153
-
154
-
155
-
156
-
157
-
158
-
159
-
160
-
161
-
162
-
163
-
164
-
165
-
166
-
167
-
168
-
169
-
170
-
171
-
172
-
173
-
174
-
175
-
176
-
177
-
178
-
179
-
180
-
181
-
182
-
183
-
184
-
185
-
186
-
187
-
188
-
189
-
190
-
191
-
192
-
193
-
194
-
195
-
196
-
197
-
198
-
199
-
200
-
201
-
202
-
203
-
204
-
205
-
206
-
207
-
208
-
209
-
210
-
211
-
212
-
213
-
214
-
215
-
216
-
217
-
218
-
219
-
220
-
221
-
222
-
223
-
224
-
225
-
226
-
227
-
228
-
229
-
230
-
231
-
232
-
233
-
234
-
235
-
236
-
237
-
238
-
239
-
240
-
241
-
242
-
243
-
244
-
245
-
246
-
247
-
248
-
249
-
250
-
251
-
252
-
253
-
254
-
255
-
256
-
257
-
258
-
259
-
260
-
261
-
262
-
263
-
264
-
265
-
266
-
267
-
268
-
269
-
270
-
271
-
272
-
273
-
274
-
275
-
276
-
277
-
278
-
279
-
280
-
281
-
282
-
283
-
284
-
285
-
286
-
287
-
288
-
289
-
290
-
291
-
292
-
293
-
294
-
295
-
296
-
297
-
298
-
299
-
300
-
301
-
302
-
303
-
304
-
305
-
306
-
307
-
308
-
309
-
310
-
311
-
312
-
313
-
314
-
315
-
316
-
317
-
318
-
319
-
320
-
321
-
322
-
323
-
324
-
325
-
326
-
327
-
328
-
329
-
330
-
331
-
332
 |
 |
94
Liquidity Monitoring and Measurement
Stress Testing
Liquidity stress testing is performed for each of Citi’s major entities, operating
subsidiaries and/or countries. Stress testing and scenario analyses are
intended to quantify the potential impact of a liquidity event on the balance
sheet and liquidity position, and to identify viable funding alternatives that
can be utilized. These scenarios include assumptions about significant
changes in key funding sources, market triggers (such as credit ratings),
potential uses of funding and political and economic conditions in certain
countries. These conditions include expected and stressed market conditions
as well as Company-specific events.
Liquidity stress tests are conducted to ascertain potential mismatches
between liquidity sources and uses over a variety of time horizons (overnight,
one week, two weeks, one month, three months, one year) and over a variety
of stressed conditions. Liquidity limits are set accordingly. To monitor
the liquidity of an entity, these stress tests and potential mismatches are
calculated with varying frequencies, with several tests performed daily.
Given the range of potential stresses, Citi maintains a series of
contingency funding plans on a consolidated basis and for individual
entities. These plans specify a wide range of readily available actions for a
variety of adverse market conditions or idiosyncratic stresses.
Short-Term Liquidity Measurement: Liquidity Coverage
Ratio (LCR)
In addition to internal measures that Citi has developed for a 30-day stress
scenario, Citi also monitors its liquidity by reference to the LCR, as calculated
pursuant to the U.S. LCR rules.
Generally, the LCR is designed to ensure that banks maintain an adequate
level of HQLA to meet liquidity needs under an acute 30-day stress scenario.
The LCR is calculated by dividing HQLA by estimated net outflows over
a stressed 30-day period, with the net outflows determined by applying
prescribed outflow factors to various categories of liabilities, such as deposits,
unsecured and secured wholesale borrowings, unused lending commitments
and derivatives-related exposures, partially offset by inflows from assets
maturing within 30 days. Banks are required to calculate an add-on to
address potential maturity mismatches between contractual cash outflows
and inflows within the 30-day period in determining the total amount of net
outflows. The minimum LCR requirement is 90% effective January 2016,
increasing to 100% in January 2017.
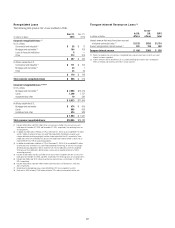
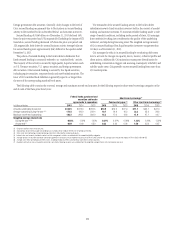
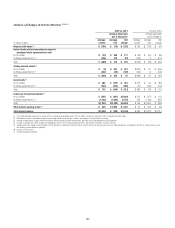
The table below sets forth the components of Citi’s LCR calculation and
HQLA in excess of net outflows as of the periods indicated:
In billions of dollars
Dec. 31,
2015
Sept. 30,
2015
Dec. 31,
2014
HQLA $378.5 $ 398.9 $ 412.6
Net outflows 336.5 355.6 368.6
LCR 112% 112% 112%
HQLA in excess of net outflows $ 42.0 $ 43.3 $ 44.0
As set forth in the table above, Citi’s LCR was unchanged both year-over-
year and quarter-over-quarter, as the reduction in Citi’s HQLA was offset by a
reduction in net outflows, reflecting reductions in Citi’s long-term debt and
short-term borrowings.
Long-Term Liquidity Measurement: Net Stable Funding
Ratio (NSFR)
For 12-month liquidity stress periods, Citi uses several measures, including
its internal long-term liquidity measure, based on a 12-month scenario
assuming deterioration due to a combination of idiosyncratic and market
stresses of moderate to high severity. It is broadly defined as the ratio of
unencumbered liquidity resources to net stressed cumulative outflows over a
12-month period.
In addition, in October 2014, the Basel Committee on Banking
Supervision (Basel Committee) issued final standards for the implementation
of the Basel III NSFR, with full compliance required by January 1, 2018.
Similar to Citi’s internal long-term liquidity measure, the NSFR is intended
to measure the stability of a banking organization’s funding over a one-year
time horizon. Pursuant to the Basel Committee’s final standards, the NSFR
is calculated by dividing the level of a bank’s available stable funding by its
required stable funding. The ratio is required to be greater than 100%. Under
the Basel Committee standards, available stable funding primarily includes
portions of equity, deposits and long-term debt, while required stable funding
primarily includes the portion of long-term assets which are deemed illiquid.
The U.S. banking agencies have not yet proposed the U.S. version of the
NSFR, although a proposal is expected during 2016.