Citibank 2015 Annual Report Download - page 229
Download and view the complete annual report
Please find page 229 of the 2015 Citibank annual report below. You can navigate through the pages in the report by either clicking on the pages listed below, or by using the keyword search tool below to find specific information within the annual report.-
 1
1 -
2
-
3
-
4
-
5
-
6
-
7
-
8
-
9
-
10
-
11
-
12
-
13
-
14
-
15
-
16
-
17
-
18
-
19
-
20
-
21
-
22
-
23
-
24
-
25
-
26
-
27
-
28
-
29
-
30
-
31
-
32
-
33
-
34
-
35
-
36
-
37
-
38
-
39
-
40
-
41
-
42
-
43
-
44
-
45
-
46
-
47
-
48
-
49
-
50
-
51
-
52
-
53
-
54
-
55
-
56
-
57
-
58
-
59
-
60
-
61
-
62
-
63
-
64
-
65
-
66
-
67
-
68
-
69
-
70
-
71
-
72
-
73
-
74
-
75
-
76
-
77
-
78
-
79
-
80
-
81
-
82
-
83
-
84
-
85
-
86
-
87
-
88
-
89
-
90
-
91
-
92
-
93
-
94
-
95
-
96
-
97
-
98
-
99
-
100
-
101
-
102
-
103
-
104
-
105
-
106
-
107
-
108
-
109
-
110
-
111
-
112
-
113
-
114
-
115
-
116
-
117
-
118
-
119
-
120
-
121
-
122
-
123
-
124
-
125
-
126
-
127
-
128
-
129
-
130
-
131
-
132
-
133
-
134
-
135
-
136
-
137
-
138
-
139
-
140
-
141
-
142
-
143
-
144
-
145
-
146
-
147
-
148
-
149
-
150
-
151
-
152
-
153
-
154
-
155
-
156
-
157
-
158
-
159
-
160
-
161
-
162
-
163
-
164
-
165
-
166
-
167
-
168
-
169
-
170
-
171
-
172
-
173
-
174
-
175
-
176
-
177
-
178
-
179
-
180
-
181
-
182
-
183
-
184
-
185
-
186
-
187
-
188
-
189
-
190
-
191
-
192
-
193
-
194
-
195
-
196
-
197
-
198
-
199
-
200
-
201
-
202
-
203
-
204
-
205
-
206
-
207
-
208
-
209
-
210
-
211
-
212
-
213
-
214
-
215
-
216
-
217
-
218
-
 219
219 -
 220
220 -
 221
221 -
 222
222 -
 223
223 -
 224
224 -
 225
225 -
 226
226 -
 227
227 -
 228
228 -
 229
229 -
 230
230 -
 231
231 -
 232
232 -
 233
233 -
 234
234 -
 235
235 -
 236
236 -
 237
237 -
 238
238 -
 239
239 -
240
-
241
-
242
-
243
-
244
-
245
-
246
-
247
-
248
-
249
-
250
-
251
-
252
-
253
-
254
-
255
-
256
-
257
-
258
-
259
-
260
-
261
-
262
-
263
-
264
-
265
-
266
-
267
-
268
-
269
-
270
-
271
-
272
-
273
-
274
-
275
-
276
-
277
-
278
-
279
-
280
-
281
-
282
-
283
-
284
-
285
-
286
-
287
-
288
-
289
-
290
-
291
-
292
-
293
-
294
-
295
-
296
-
297
-
298
-
299
-
300
-
301
-
302
-
303
-
304
-
305
-
306
-
307
-
308
-
309
-
310
-
311
-
312
-
313
-
314
-
315
-
316
-
317
-
318
-
319
-
320
-
321
-
322
-
323
-
324
-
325
-
326
-
327
-
328
-
329
-
330
-
331
-
332
 |
 |

211
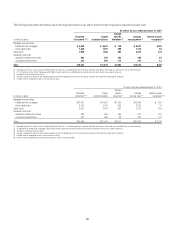
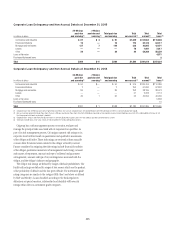
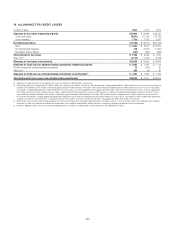
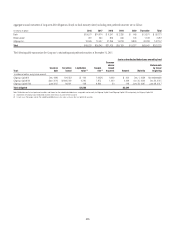
Allowance for Credit Losses and Investment in Loans at December 31, 2015
In millions of dollars Corporate Consumer Total
Allowance for loan losses at beginning of period $ 2,389 $ 13,605 $ 15,994
Charge-offs (331) (8,710) (9,041)
Recoveries 97 1,642 1,739
Replenishment of net charge-offs 234 7,068 7,302
Net reserve builds (releases) 523 (384) 139
Net specific reserve builds (releases) 86 (419) (333)
Other (288) (2,886) (3,174)
Ending balance $ 2,710 $ 9,916 $ 12,626
Allowance for loan losses
Determined in accordance with ASC 450 $ 2,345 $ 7,839 $ 10,184
Determined in accordance with ASC 310-10-35 362 2,064 2,426
Determined in accordance with ASC 310-30 3 13 16
Total allowance for loan losses $ 2,710 $ 9,916 $ 12,626
Loans, net of unearned income
Loans collectively evaluated for impairment in accordance with ASC 450 $281,066 $319,301 $600,367
Loans individually evaluated for impairment in accordance with ASC 310-10-35 1,792 10,203 11,995
Loans acquired with deteriorated credit quality in accordance with ASC 310-30 5 245 250
Loans held at fair value 4,971 34 5,005
Total loans, net of unearned income $287,834 $329,783 $617,617
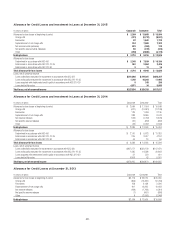
Allowance for Credit Losses and Investment in Loans at December 31, 2014
In millions of dollars Corporate Consumer Total
Allowance for loan losses at beginning of period $ 2,584 $ 17,064 $ 19,648
Charge-offs (427) (10,681) (11,108)
Recoveries 139 1,996 2,135
Replenishment of net charge-offs 288 8,685 8,973
Net reserve releases (133) (1,746) (1,879)
Net specific reserve releases (20) (246) (266)
Other (42) (1,467) (1,509)
Ending balance $ 2,389 $ 13,605 $ 15,994
Allowance for loan losses
Determined in accordance with ASC 450 $ 2,110 $ 9,673 $ 11,783
Determined in accordance with ASC 310-10-35 235 3,917 4,152
Determined in accordance with ASC 310-30 44 15 59
Total allowance for loan losses $ 2,389 $ 13,605 $ 15,994
Loans, net of unearned income
Loans collectively evaluated for impairment in accordance with ASC 450 $267,271 $350,199 $617,470
Loans individually evaluated for impairment in accordance with ASC 310-10-35 1,485 19,358 20,843
Loans acquired with deteriorated credit quality in accordance with ASC 310-30 51 370 421
Loans held at fair value 5,858 43 5,901
Total loans, net of unearned income $274,665 $369,970 $644,635
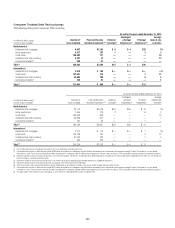
Allowance for Credit Losses at December 31, 2013
In millions of dollars Corporate Consumer Total
Allowance for loan losses at beginning of period $2,776 $ 22,679 $ 25,455
Charge-offs (369) (12,400) (12,769)
Recoveries 168 2,138 2,306
Replenishment of net charge-offs 201 10,262 10,463
Net reserve releases (199) (1,762) (1,961)
Net specific reserve releases (1) (897) (898)
Other 8 (2,956) (2,948)
Ending balance $2,584 $ 17,064 $ 19,648