Citibank 2015 Annual Report Download - page 91
Download and view the complete annual report
Please find page 91 of the 2015 Citibank annual report below. You can navigate through the pages in the report by either clicking on the pages listed below, or by using the keyword search tool below to find specific information within the annual report.-
 1
1 -
2
-
3
-
4
-
5
-
6
-
7
-
8
-
9
-
10
-
11
-
12
-
13
-
14
-
15
-
16
-
17
-
18
-
19
-
20
-
21
-
22
-
23
-
24
-
25
-
26
-
27
-
28
-
29
-
30
-
31
-
32
-
33
-
34
-
35
-
36
-
37
-
38
-
39
-
40
-
41
-
42
-
43
-
44
-
45
-
46
-
47
-
48
-
49
-
50
-
51
-
52
-
53
-
54
-
55
-
56
-
57
-
58
-
59
-
60
-
61
-
62
-
63
-
64
-
65
-
66
-
67
-
68
-
69
-
70
-
71
-
72
-
73
-
74
-
75
-
76
-
77
-
78
-
79
-
80
-
 81
81 -
 82
82 -
 83
83 -
 84
84 -
 85
85 -
 86
86 -
 87
87 -
 88
88 -
 89
89 -
 90
90 -
 91
91 -
 92
92 -
 93
93 -
 94
94 -
 95
95 -
 96
96 -
 97
97 -
 98
98 -
 99
99 -
 100
100 -
 101
101 -
102
-
103
-
104
-
105
-
106
-
107
-
108
-
109
-
110
-
111
-
112
-
113
-
114
-
115
-
116
-
117
-
118
-
119
-
120
-
121
-
122
-
123
-
124
-
125
-
126
-
127
-
128
-
129
-
130
-
131
-
132
-
133
-
134
-
135
-
136
-
137
-
138
-
139
-
140
-
141
-
142
-
143
-
144
-
145
-
146
-
147
-
148
-
149
-
150
-
151
-
152
-
153
-
154
-
155
-
156
-
157
-
158
-
159
-
160
-
161
-
162
-
163
-
164
-
165
-
166
-
167
-
168
-
169
-
170
-
171
-
172
-
173
-
174
-
175
-
176
-
177
-
178
-
179
-
180
-
181
-
182
-
183
-
184
-
185
-
186
-
187
-
188
-
189
-
190
-
191
-
192
-
193
-
194
-
195
-
196
-
197
-
198
-
199
-
200
-
201
-
202
-
203
-
204
-
205
-
206
-
207
-
208
-
209
-
210
-
211
-
212
-
213
-
214
-
215
-
216
-
217
-
218
-
219
-
220
-
221
-
222
-
223
-
224
-
225
-
226
-
227
-
228
-
229
-
230
-
231
-
232
-
233
-
234
-
235
-
236
-
237
-
238
-
239
-
240
-
241
-
242
-
243
-
244
-
245
-
246
-
247
-
248
-
249
-
250
-
251
-
252
-
253
-
254
-
255
-
256
-
257
-
258
-
259
-
260
-
261
-
262
-
263
-
264
-
265
-
266
-
267
-
268
-
269
-
270
-
271
-
272
-
273
-
274
-
275
-
276
-
277
-
278
-
279
-
280
-
281
-
282
-
283
-
284
-
285
-
286
-
287
-
288
-
289
-
290
-
291
-
292
-
293
-
294
-
295
-
296
-
297
-
298
-
299
-
300
-
301
-
302
-
303
-
304
-
305
-
306
-
307
-
308
-
309
-
310
-
311
-
312
-
313
-
314
-
315
-
316
-
317
-
318
-
319
-
320
-
321
-
322
-
323
-
324
-
325
-
326
-
327
-
328
-
329
-
330
-
331
-
332
 |
 |

73
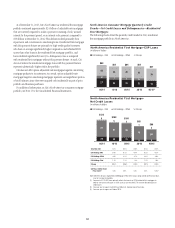
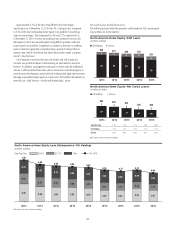
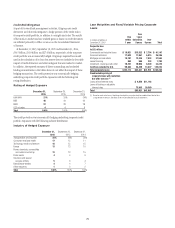
As evidenced by the tables above, net credit losses in the North America
home equity loan portfolio continued to improve during 2015, largely
driven by the continued improvement in HPI. Delinquencies in the portfolio
also improved during 2015, primarily due to liquidations and continued
management actions, including the transfer of CitiFinancial home
equity loans to held-for-sale in the fourth quarter of 2015 and continued
modifications, partially offset by increased delinquencies associated with the
increase in Revolving HELOCs commencing amortization.
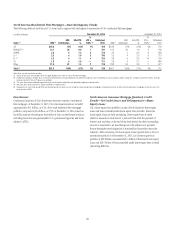
Given the limited market in which to sell delinquent home equity
loans to date, as well as the relatively smaller number of home equity loan
modifications and modification programs (see Note 15 to the Consolidated
Financial Statements), Citi’s ability to reduce delinquencies or net credit
losses in its home equity loan portfolio in Citi Holdings, whether pursuant to
deterioration of the underlying credit performance of these loans, the reset of
the Revolving HELOCs (as discussed above) or otherwise, is more limited as
compared to residential first mortgages.
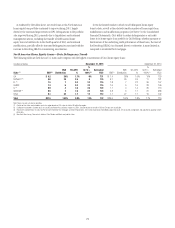
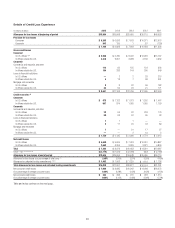
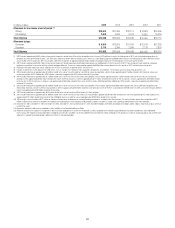
North America Home Equity Loans—State Delinquency Trends
The following tables set forth the six U.S. states and/or regions with the highest concentration of Citi’s home equity loans:
In billions of dollars December 31, 2015 December 31, 2014
State (1) ENR (2)
ENR
Distribution
90+DPD
%
%
CLTV >
100% (3)
Refreshed
FICO ENR (2)
ENR
Distribution
90+DPD
%
%
CLTV >
100% (3)
Refreshed
FICO
CA $ 6.2 29% 1.7% 6% 731 $ 7.4 28% 1.5% 10% 729
NY/NJ/CT (4) 6.0 28 2.5 8 725 6.7 25 2.4 11 721
FL (4) 1.5 7 2.0 24 715 1.8 7 2.2 36 707
VA/MD 1.3 6 2.0 23 715 1.6 6 1.6 28 706
IL (4) 0.9 4 1.6 29 722 1.1 4 1.4 35 716
IN/OH/MI (4) 0.5 3 1.9 24 703 0.8 3 1.7 31 688
Other 5.1 24 1.7 12 712 7.1 27 1.7 19 702
Total $21.5 100% 2.0% 12% 722 $26.6 100% 1.8% 17% 715
Note: Totals may not sum due to rounding.
(1) Certain of the states are included as part of a region based on Citi’s view of similar HPI within the region.
(2) Ending net receivables. Excludes loans in Canada and Puerto Rico and loans subject to LTSCs. Excludes balances for which FICO or LTV data are unavailable.
(3) Represents combined loan-to-value (CLTV) for both residential first mortgages and home equity loans. CLTV ratios (loan balance divided by appraised value) are calculated at origination and updated by applying market
price data.
(4) New York, New Jersey, Connecticut, Indiana, Ohio, Florida and Illinois are judicial states.