Citibank 2015 Annual Report Download - page 285
Download and view the complete annual report
Please find page 285 of the 2015 Citibank annual report below. You can navigate through the pages in the report by either clicking on the pages listed below, or by using the keyword search tool below to find specific information within the annual report.-
 1
1 -
2
-
3
-
4
-
5
-
6
-
7
-
8
-
9
-
10
-
11
-
12
-
13
-
14
-
15
-
16
-
17
-
18
-
19
-
20
-
21
-
22
-
23
-
24
-
25
-
26
-
27
-
28
-
29
-
30
-
31
-
32
-
33
-
34
-
35
-
36
-
37
-
38
-
39
-
40
-
41
-
42
-
43
-
44
-
45
-
46
-
47
-
48
-
49
-
50
-
51
-
52
-
53
-
54
-
55
-
56
-
57
-
58
-
59
-
60
-
61
-
62
-
63
-
64
-
65
-
66
-
67
-
68
-
69
-
70
-
71
-
72
-
73
-
74
-
75
-
76
-
77
-
78
-
79
-
80
-
81
-
82
-
83
-
84
-
85
-
86
-
87
-
88
-
89
-
90
-
91
-
92
-
93
-
94
-
95
-
96
-
97
-
98
-
99
-
100
-
101
-
102
-
103
-
104
-
105
-
106
-
107
-
108
-
109
-
110
-
111
-
112
-
113
-
114
-
115
-
116
-
117
-
118
-
119
-
120
-
121
-
122
-
123
-
124
-
125
-
126
-
127
-
128
-
129
-
130
-
131
-
132
-
133
-
134
-
135
-
136
-
137
-
138
-
139
-
140
-
141
-
142
-
143
-
144
-
145
-
146
-
147
-
148
-
149
-
150
-
151
-
152
-
153
-
154
-
155
-
156
-
157
-
158
-
159
-
160
-
161
-
162
-
163
-
164
-
165
-
166
-
167
-
168
-
169
-
170
-
171
-
172
-
173
-
174
-
175
-
176
-
177
-
178
-
179
-
180
-
181
-
182
-
183
-
184
-
185
-
186
-
187
-
188
-
189
-
190
-
191
-
192
-
193
-
194
-
195
-
196
-
197
-
198
-
199
-
200
-
201
-
202
-
203
-
204
-
205
-
206
-
207
-
208
-
209
-
210
-
211
-
212
-
213
-
214
-
215
-
216
-
217
-
218
-
219
-
220
-
221
-
222
-
223
-
224
-
225
-
226
-
227
-
228
-
229
-
230
-
231
-
232
-
233
-
234
-
235
-
236
-
237
-
238
-
239
-
240
-
241
-
242
-
243
-
244
-
245
-
246
-
247
-
248
-
249
-
250
-
251
-
252
-
253
-
254
-
255
-
256
-
257
-
258
-
259
-
260
-
261
-
262
-
263
-
264
-
265
-
266
-
267
-
268
-
269
-
270
-
271
-
272
-
273
-
274
-
 275
275 -
 276
276 -
 277
277 -
 278
278 -
 279
279 -
 280
280 -
 281
281 -
 282
282 -
 283
283 -
 284
284 -
 285
285 -
 286
286 -
 287
287 -
 288
288 -
 289
289 -
 290
290 -
 291
291 -
 292
292 -
 293
293 -
 294
294 -
 295
295 -
296
-
297
-
298
-
299
-
300
-
301
-
302
-
303
-
304
-
305
-
306
-
307
-
308
-
309
-
310
-
311
-
312
-
313
-
314
-
315
-
316
-
317
-
318
-
319
-
320
-
321
-
322
-
323
-
324
-
325
-
326
-
327
-
328
-
329
-
330
-
331
-
332
 |
 |
267
Credit Spread
Credit spread is a component of the security representing its credit quality.
Credit spread reflects the market perception of changes in prepayment,
delinquency and recovery rates, therefore capturing the impact of other
variables on the fair value. Changes in credit spread affect the fair value of
securities differently depending on the characteristics and maturity profile of
the security. For example, credit spread is a more significant driver of the fair
value measurement of a high yield bond as compared to an investment grade
bond. Generally, the credit spread for an investment grade bond is also more
observable and less volatile than its high yield counterpart.
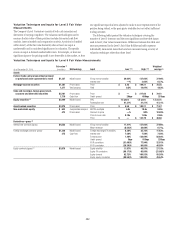
Qualitative Discussion of the Ranges of Significant
Unobservable Inputs
The following section describes the ranges of the most significant
unobservable inputs used by the Company in Level 3 fair value
measurements. The level of aggregation and the diversity of instruments held
by the Company lead to a wide range of unobservable inputs that may not be
evenly distributed across the Level 3 inventory.
Correlation
There are many different types of correlation inputs, including credit
correlation, cross-asset correlation (such as equity-interest rate correlation),
and same-asset correlation (such as interest rate-interest rate correlation).
Correlation inputs are generally used to value hybrid and exotic instruments.
Generally, same-asset correlation inputs have a narrower range than cross-
asset correlation inputs. However, due to the complex and unique nature
of these instruments, the ranges for correlation inputs can vary widely
across portfolios.
Volatility
Similar to correlation, asset-specific volatility inputs vary widely by asset type.
For example, ranges for foreign exchange volatility are generally lower and
narrower than equity volatility. Equity volatilities are wider due to the nature
of the equities market and the terms of certain exotic instruments. For most
instruments, the interest rate volatility input is on the lower end of the range;
however, for certain structured or exotic instruments (such as market-linked
deposits or exotic interest rate derivatives), the range is much wider.
Yield
Ranges for the yield inputs vary significantly depending upon the type of
security. For example, securities that typically have lower yields, such as
municipal bonds, will fall on the lower end of the range, while more illiquid
securities or securities with lower credit quality, such as certain residual
tranche asset-backed securities, will have much higher yield inputs.
Credit Spread
Credit spread is relevant primarily for fixed income and credit instruments;
however, the ranges for the credit spread input can vary across instruments.
For example, certain fixed income instruments, such as certificates of deposit,
typically have lower credit spreads, whereas certain derivative instruments
with high-risk counterparties are typically subject to higher credit spreads
when they are uncollateralized or have a longer tenor. Other instruments,
such as credit default swaps, also have credit spreads that vary with the
attributes of the underlying obligor. Stronger companies have tighter credit
spreads, and weaker companies have wider credit spreads.
Price
The price input is a significant unobservable input for certain fixed
income instruments. For these instruments, the price input is expressed as
a percentage of the notional amount, with a price of $100 meaning that
the instrument is valued at par. For most of these instruments, the price
varies between zero to $100, or slightly above $100. Relatively illiquid assets
that have experienced significant losses since issuance, such as certain
asset-backed securities, are at the lower end of the range, whereas most
investment grade corporate bonds will fall in the middle to the higher end of
the range. For certain structured debt instruments with embedded derivatives,
the price input may be above $100 to reflect the embedded features of the
instrument (for example, a step-up coupon or a conversion option).
The price input is also a significant unobservable input for certain equity
securities; however, the range of price inputs varies depending on the nature
of the position, the number of shares outstanding and other factors.
Mean Reversion
A number of financial instruments require an estimate of the rate at which
the interest rate reverts to its long term average. Changes in this estimate can
significantly affect the fair value of these instruments. However, sometimes
there is insufficient external market data to calibrate this parameter,
especially when pricing more complex instruments. The level of mean
reversion affects the correlation between short and long term interest rates.
The fair values of more complex instruments, such as Bermudan swaptions
(options with multiple exercise dates) and constant maturity spread options
or structured debts with these embedded features, are more sensitive to the
changes in this correlation as compared to less complex instruments, such as
caps and floors.