Citibank 2015 Annual Report Download - page 241
Download and view the complete annual report
Please find page 241 of the 2015 Citibank annual report below. You can navigate through the pages in the report by either clicking on the pages listed below, or by using the keyword search tool below to find specific information within the annual report.-
 1
1 -
2
-
3
-
4
-
5
-
6
-
7
-
8
-
9
-
10
-
11
-
12
-
13
-
14
-
15
-
16
-
17
-
18
-
19
-
20
-
21
-
22
-
23
-
24
-
25
-
26
-
27
-
28
-
29
-
30
-
31
-
32
-
33
-
34
-
35
-
36
-
37
-
38
-
39
-
40
-
41
-
42
-
43
-
44
-
45
-
46
-
47
-
48
-
49
-
50
-
51
-
52
-
53
-
54
-
55
-
56
-
57
-
58
-
59
-
60
-
61
-
62
-
63
-
64
-
65
-
66
-
67
-
68
-
69
-
70
-
71
-
72
-
73
-
74
-
75
-
76
-
77
-
78
-
79
-
80
-
81
-
82
-
83
-
84
-
85
-
86
-
87
-
88
-
89
-
90
-
91
-
92
-
93
-
94
-
95
-
96
-
97
-
98
-
99
-
100
-
101
-
102
-
103
-
104
-
105
-
106
-
107
-
108
-
109
-
110
-
111
-
112
-
113
-
114
-
115
-
116
-
117
-
118
-
119
-
120
-
121
-
122
-
123
-
124
-
125
-
126
-
127
-
128
-
129
-
130
-
131
-
132
-
133
-
134
-
135
-
136
-
137
-
138
-
139
-
140
-
141
-
142
-
143
-
144
-
145
-
146
-
147
-
148
-
149
-
150
-
151
-
152
-
153
-
154
-
155
-
156
-
157
-
158
-
159
-
160
-
161
-
162
-
163
-
164
-
165
-
166
-
167
-
168
-
169
-
170
-
171
-
172
-
173
-
174
-
175
-
176
-
177
-
178
-
179
-
180
-
181
-
182
-
183
-
184
-
185
-
186
-
187
-
188
-
189
-
190
-
191
-
192
-
193
-
194
-
195
-
196
-
197
-
198
-
199
-
200
-
201
-
202
-
203
-
204
-
205
-
206
-
207
-
208
-
209
-
210
-
211
-
212
-
213
-
214
-
215
-
216
-
217
-
218
-
219
-
220
-
221
-
222
-
223
-
224
-
225
-
226
-
227
-
228
-
229
-
230
-
 231
231 -
 232
232 -
 233
233 -
 234
234 -
 235
235 -
 236
236 -
 237
237 -
 238
238 -
 239
239 -
 240
240 -
 241
241 -
 242
242 -
 243
243 -
 244
244 -
 245
245 -
 246
246 -
 247
247 -
 248
248 -
 249
249 -
 250
250 -
 251
251 -
252
-
253
-
254
-
255
-
256
-
257
-
258
-
259
-
260
-
261
-
262
-
263
-
264
-
265
-
266
-
267
-
268
-
269
-
270
-
271
-
272
-
273
-
274
-
275
-
276
-
277
-
278
-
279
-
280
-
281
-
282
-
283
-
284
-
285
-
286
-
287
-
288
-
289
-
290
-
291
-
292
-
293
-
294
-
295
-
296
-
297
-
298
-
299
-
300
-
301
-
302
-
303
-
304
-
305
-
306
-
307
-
308
-
309
-
310
-
311
-
312
-
313
-
314
-
315
-
316
-
317
-
318
-
319
-
320
-
321
-
322
-
323
-
324
-
325
-
326
-
327
-
328
-
329
-
330
-
331
-
332
 |
 |

223
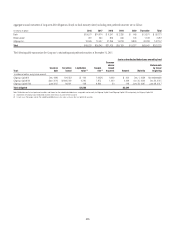
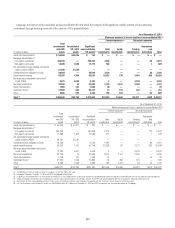
Citigroup’s involvement with consolidated and unconsolidated VIEs with which the Company holds significant variable interests or has continuing
involvement through servicing a majority of the assets in a VIE is presented below:
As of December 31, 2015
Maximum exposure to loss in significant unconsolidated VIEs (1)
Funded exposures (2) Unfunded exposures
In millions of dollars
Total
involvement
with SPE
assets
Consolidated
VIE / SPE
assets
Significant
unconsolidated
VIE assets
(3)
Debt
investments
Equity
investments
Funding
commitments
Guarantees
and
derivatives Total
Credit card securitizations $ 55,050 $54,916 $ 134 $ — $ — $ — $ — $ —
Mortgage securitizations (4)
U.S. agency-sponsored 236,225 — 236,225 3,582 — — 95 3,677
Non-agency-sponsored 14,305 1,586 12,719 528 — — 1 529
Citi-administered asset-backed commercial
paper conduits (ABCP) 21,280 21,280 — — — — — —
Collateralized loan obligations (CLOs) 20,564 — 20,564 3,154 — — 86 3,240
Asset-based financing 83,397 1,364 82,033 25,923 270 3,891 436 30,520
Municipal securities tender option bond
trusts (TOBs) 8,572 3,830 4,742 2 — 3,100 — 3,102
Municipal investments 22,935 44 22,891 2,275 2,512 2,338 — 7,125
Client intermediation 1,965 335 1,630 49 — — — 49
Investment funds (5) 27,569 842 26,727 13 318 102 — 433
Other 4,986 597 4,389 292 554 — 52 898
Total (6) $496,848 $84,794 $412,054 $35,818 $ 3,654 $9,431 $670 $49,573
As of December 31, 2014
Maximum exposure to loss in significant unconsolidated VIEs (1)
Funded exposures (2) Unfunded exposures
In millions of dollars
Total
involvement
with SPE
assets
Consolidated
VIE / SPE
assets
Significant
unconsolidated
VIE assets (3)
Debt
investments
Equity
investments
Funding
commitments
Guarantees
and
derivatives Total
Credit card securitizations $ 60,503 $ 60,271 $ 232 $ — $ — $ — $ — $ —
Mortgage securitizations (4)
U.S. agency-sponsored 264,848 — 264,848 5,213 — — 110 5,323
Non-agency-sponsored 17,888 1,304 16,584 577 — — 1 578
Citi-administered asset-backed commercial
paper conduits (ABCP) 29,181 29,181 — — — — — —
Collateralized loan obligations (CLOs) 19,736 — 19,736 1,965 — — 86 2,051
Asset-based financing 63,900 1,151 62,749 22,928 66 2,271 333 25,598
Municipal securities tender option bond
trusts (TOBs) 12,280 6,671 5,609 3 — 3,670 — 3,673
Municipal investments 23,706 70 23,636 2,014 2,197 2,225 — 6,436
Client intermediation 1,745 137 1,608 10 — — 10 20
Investment funds (5) 31,992 1,096 30,896 16 382 124 — 522
Other 8,298 2,909 5,389 183 1,451 23 73 1,730
Total (6) $ 534,077 $102,790 $431,287 $ 32,909 $ 4,096 $ 8,313 $613 $ 45,931
(1) The definition of maximum exposure to loss is included in the text that follows this table.
(2) Included on Citigroup’s December 31, 2015 and 2014 Consolidated Balance Sheet.
(3) A significant unconsolidated VIE is an entity where the Company has any variable interest or continuing involvement considered to be significant, regardless of the likelihood of loss or the notional amount of exposure.
(4) Citigroup mortgage securitizations also include agency and non-agency (private-label) re-securitization activities. These SPEs are not consolidated. See “Re-securitizations” below for further discussion.
(5) Substantially all of the unconsolidated investment funds’ assets are related to retirement funds in Mexico managed by Citi. See “Investment Funds” below for further discussion.
(6) Citi’s total involvement with Citicorp SPE assets was $460.5 billion and $481.3 billion as of December 31, 2015 and 2014, respectively, with the remainder related to Citi Holdings.