Citibank 2015 Annual Report Download - page 313
Download and view the complete annual report
Please find page 313 of the 2015 Citibank annual report below. You can navigate through the pages in the report by either clicking on the pages listed below, or by using the keyword search tool below to find specific information within the annual report.-
 1
1 -
2
-
3
-
4
-
5
-
6
-
7
-
8
-
9
-
10
-
11
-
12
-
13
-
14
-
15
-
16
-
17
-
18
-
19
-
20
-
21
-
22
-
23
-
24
-
25
-
26
-
27
-
28
-
29
-
30
-
31
-
32
-
33
-
34
-
35
-
36
-
37
-
38
-
39
-
40
-
41
-
42
-
43
-
44
-
45
-
46
-
47
-
48
-
49
-
50
-
51
-
52
-
53
-
54
-
55
-
56
-
57
-
58
-
59
-
60
-
61
-
62
-
63
-
64
-
65
-
66
-
67
-
68
-
69
-
70
-
71
-
72
-
73
-
74
-
75
-
76
-
77
-
78
-
79
-
80
-
81
-
82
-
83
-
84
-
85
-
86
-
87
-
88
-
89
-
90
-
91
-
92
-
93
-
94
-
95
-
96
-
97
-
98
-
99
-
100
-
101
-
102
-
103
-
104
-
105
-
106
-
107
-
108
-
109
-
110
-
111
-
112
-
113
-
114
-
115
-
116
-
117
-
118
-
119
-
120
-
121
-
122
-
123
-
124
-
125
-
126
-
127
-
128
-
129
-
130
-
131
-
132
-
133
-
134
-
135
-
136
-
137
-
138
-
139
-
140
-
141
-
142
-
143
-
144
-
145
-
146
-
147
-
148
-
149
-
150
-
151
-
152
-
153
-
154
-
155
-
156
-
157
-
158
-
159
-
160
-
161
-
162
-
163
-
164
-
165
-
166
-
167
-
168
-
169
-
170
-
171
-
172
-
173
-
174
-
175
-
176
-
177
-
178
-
179
-
180
-
181
-
182
-
183
-
184
-
185
-
186
-
187
-
188
-
189
-
190
-
191
-
192
-
193
-
194
-
195
-
196
-
197
-
198
-
199
-
200
-
201
-
202
-
203
-
204
-
205
-
206
-
207
-
208
-
209
-
210
-
211
-
212
-
213
-
214
-
215
-
216
-
217
-
218
-
219
-
220
-
221
-
222
-
223
-
224
-
225
-
226
-
227
-
228
-
229
-
230
-
231
-
232
-
233
-
234
-
235
-
236
-
237
-
238
-
239
-
240
-
241
-
242
-
243
-
244
-
245
-
246
-
247
-
248
-
249
-
250
-
251
-
252
-
253
-
254
-
255
-
256
-
257
-
258
-
259
-
260
-
261
-
262
-
263
-
264
-
265
-
266
-
267
-
268
-
269
-
270
-
271
-
272
-
273
-
274
-
275
-
276
-
277
-
278
-
279
-
280
-
281
-
282
-
283
-
284
-
285
-
286
-
287
-
288
-
289
-
290
-
291
-
292
-
293
-
294
-
295
-
296
-
297
-
298
-
299
-
300
-
301
-
302
-
 303
303 -
 304
304 -
 305
305 -
 306
306 -
 307
307 -
 308
308 -
 309
309 -
 310
310 -
 311
311 -
 312
312 -
 313
313 -
 314
314 -
 315
315 -
 316
316 -
 317
317 -
 318
318 -
 319
319 -
 320
320 -
 321
321 -
 322
322 -
 323
323 -
324
-
325
-
326
-
327
-
328
-
329
-
330
-
331
-
332
 |
 |

295
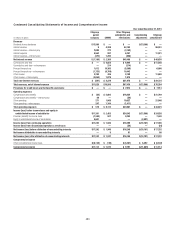
Condensed Consolidating Statements of Income and Comprehensive Income
Year ended December 31, 2014
In millions of dollars
Citigroup
parent
company CGMHI
Other Citigroup
subsidiaries and
eliminations
Consolidating
adjustments
Citigroup
consolidated
Revenues
Dividends from subsidiaries $ 8,900 $ — $ — $(8,900) $ —
Interest revenue 12 4,210 57,461 — 61,683
Interest revenue—intercompany 3,109 144 (3,253) — —
Interest expense 5,055 1,010 7,625 — 13,690
Interest expense—intercompany (618) 1,258 (640) — —
Net interest revenue $(1,316) $ 2,086 $47,223 $ — $47,993
Commissions and fees $ — $ 5,185 $ 7,847 $ — $13,032
Commissions and fees—intercompany — 95 (95) — —
Principal transactions 13 (1,115) 7,800 — 6,698
Principal transactions—intercompany (672) 3,822 (3,150) — —
Other income 1,037 425 8,034 — 9,496
Other income—intercompany (131) 1,206 (1,075) — —
Total non-interest revenues $ 247 $ 9,618 $19,361 $ — $ 29,226
Total revenues, net of interest expense $ 7,831 $11,704 $66,584 $(8,900) $77,219
Provisions for credit losses and for benefits and claims $ — $ — $ 7,467 $ — $ 7,467
Operating expenses
Compensation and benefits $ 158 $ 5,156 $18,645 $ — $ 23,959
Compensation and benefits—intercompany 38 — (38) — —
Other operating 1,572 6,082 23,438 — 31,092
Other operating—intercompany 212 1,651 (1,863) — —
Total operating expenses $ 1,980 $12,889 $40,182 $ — $55,051
Income (loss) before income taxes and equity in
undistributed income of subsidiaries $ 5,851 $ (1,185) $18,935 $(8,900) $14,701
Provision (benefit) for income taxes (643) 600 7,240 — 7,197
Equity in undistributed income of subsidiaries 816 — (816) —
Income (loss) from continuing operations $ 7,310 $ (1,785) $11,695 $(9,716) $ 7,504
Income (loss) from discontinued operations, net of taxes — — (2) — (2)
Net income (loss) before attribution of noncontrolling interests $ 7,310 $ (1,785) $11,693 $(9,716) $ 7,502
Net income attributable to noncontrolling interests — 8 184 — 192
Net income (loss) after attribution of noncontrolling interests $ 7,310 $ (1,793) $11,509 $(9,716) $ 7,310
Comprehensive income
Other comprehensive income (loss) $(4,083) $ 194 $ (4,760) $ 4,566 $ (4,083)
Comprehensive income $ 3,227 $ (1,599) $ 6,749 $(5,150) $ 3,227