Citibank 2015 Annual Report Download - page 56
Download and view the complete annual report
Please find page 56 of the 2015 Citibank annual report below. You can navigate through the pages in the report by either clicking on the pages listed below, or by using the keyword search tool below to find specific information within the annual report.-
 1
1 -
2
-
3
-
4
-
5
-
6
-
7
-
8
-
9
-
10
-
11
-
12
-
13
-
14
-
15
-
16
-
17
-
18
-
19
-
20
-
21
-
22
-
23
-
24
-
25
-
26
-
27
-
28
-
29
-
30
-
31
-
32
-
33
-
34
-
35
-
36
-
37
-
38
-
39
-
40
-
41
-
42
-
43
-
44
-
45
-
 46
46 -
 47
47 -
 48
48 -
 49
49 -
 50
50 -
 51
51 -
 52
52 -
 53
53 -
 54
54 -
 55
55 -
 56
56 -
 57
57 -
 58
58 -
 59
59 -
 60
60 -
 61
61 -
 62
62 -
 63
63 -
 64
64 -
 65
65 -
 66
66 -
67
-
68
-
69
-
70
-
71
-
72
-
73
-
74
-
75
-
76
-
77
-
78
-
79
-
80
-
81
-
82
-
83
-
84
-
85
-
86
-
87
-
88
-
89
-
90
-
91
-
92
-
93
-
94
-
95
-
96
-
97
-
98
-
99
-
100
-
101
-
102
-
103
-
104
-
105
-
106
-
107
-
108
-
109
-
110
-
111
-
112
-
113
-
114
-
115
-
116
-
117
-
118
-
119
-
120
-
121
-
122
-
123
-
124
-
125
-
126
-
127
-
128
-
129
-
130
-
131
-
132
-
133
-
134
-
135
-
136
-
137
-
138
-
139
-
140
-
141
-
142
-
143
-
144
-
145
-
146
-
147
-
148
-
149
-
150
-
151
-
152
-
153
-
154
-
155
-
156
-
157
-
158
-
159
-
160
-
161
-
162
-
163
-
164
-
165
-
166
-
167
-
168
-
169
-
170
-
171
-
172
-
173
-
174
-
175
-
176
-
177
-
178
-
179
-
180
-
181
-
182
-
183
-
184
-
185
-
186
-
187
-
188
-
189
-
190
-
191
-
192
-
193
-
194
-
195
-
196
-
197
-
198
-
199
-
200
-
201
-
202
-
203
-
204
-
205
-
206
-
207
-
208
-
209
-
210
-
211
-
212
-
213
-
214
-
215
-
216
-
217
-
218
-
219
-
220
-
221
-
222
-
223
-
224
-
225
-
226
-
227
-
228
-
229
-
230
-
231
-
232
-
233
-
234
-
235
-
236
-
237
-
238
-
239
-
240
-
241
-
242
-
243
-
244
-
245
-
246
-
247
-
248
-
249
-
250
-
251
-
252
-
253
-
254
-
255
-
256
-
257
-
258
-
259
-
260
-
261
-
262
-
263
-
264
-
265
-
266
-
267
-
268
-
269
-
270
-
271
-
272
-
273
-
274
-
275
-
276
-
277
-
278
-
279
-
280
-
281
-
282
-
283
-
284
-
285
-
286
-
287
-
288
-
289
-
290
-
291
-
292
-
293
-
294
-
295
-
296
-
297
-
298
-
299
-
300
-
301
-
302
-
303
-
304
-
305
-
306
-
307
-
308
-
309
-
310
-
311
-
312
-
313
-
314
-
315
-
316
-
317
-
318
-
319
-
320
-
321
-
322
-
323
-
324
-
325
-
326
-
327
-
328
-
329
-
330
-
331
-
332
 |
 |

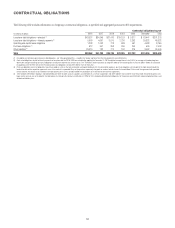
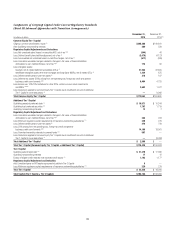
38
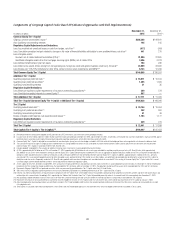
Components of Citigroup Capital Under Current Regulatory Standards
(Basel III Advanced Approaches with Transition Arrangements)
In millions of dollars
December 31,
2015
December 31,
2014 (1)
Common Equity Tier 1 Capital
Citigroup common stockholders’ equity (2) $205,286 $199,841
Add: Qualifying noncontrolling interests 369 539
Regulatory Capital Adjustments and Deductions:
Less: Net unrealized gains (losses) on securities AFS, net of tax (3)(4) (544) 46
Less: Defined benefit plans liability adjustment, net of tax (4) (3,070) (4,127)
Less: Accumulated net unrealized losses on cash flow hedges, net of tax (5) (617) (909)
Less: Cumulative unrealized net gain related to changes in fair value of financial liabilities
attributable to own creditworthiness, net of tax (4)(6) 176 56
Less: Intangible assets:
Goodwill, net of related deferred tax liabilities (DTLs) (7) 21,980 22,805
Identifiable intangible assets other than mortgage servicing rights (MSRs), net of related DTLs (4) 1,434 875
Less: Defined benefit pension plan net assets (4) 318 187
Less: Deferred tax assets (DTAs) arising from net operating loss, foreign tax credit and general
business credit carry-forwards (4)(8) 9,464 4,725
Less: Excess over 10%/15% limitations for other DTAs, certain common stock investments,
and MSRs (4)(8)(9) 2,652 1,977
Less: Deductions applied to Common Equity Tier 1 Capital due to insufficient amount of Additional
Tier 1 Capital to cover deductions (4) —8,082
Total Common Equity Tier 1 Capital $173,862 $166,663
Additional Tier 1 Capital
Qualifying perpetual preferred stock (2) $ 16,571 $ 10,344
Qualifying trust preferred securities (10) 1,707 1,719
Qualifying noncontrolling interests 12 7
Regulatory Capital Adjustment and Deductions:
Less: Cumulative unrealized net gain related to changes in fair value of financial liabilities
attributable to own creditworthiness, net of tax (4)(6) 265 223
Less: Minimum regulatory capital requirements of insurance underwriting subsidiaries (11) 229 279
Less: Defined benefit pension plan net assets (4) 476 749
Less: DTAs arising from net operating loss, foreign tax credit and general
business credit carry-forwards (4)(8) 14,195 18,901
Less: Permitted ownership interests in covered funds (12) 567 —
Less: Deductions applied to Common Equity Tier 1 Capital due to insufficient amount of Additional
Tier 1 Capital to cover deductions (4) —(8,082)
Total Additional Tier 1 Capital $ 2,558 $ —
Total Tier 1 Capital (Common Equity Tier 1 Capital + Additional Tier 1 Capital) $176,420 $166,663
Tier 2 Capital
Qualifying subordinated debt (13) $ 21,370 $ 17,386
Qualifying noncontrolling interests 17 12
Excess of eligible credit reserves over expected credit losses (14) 1,163 1,177
Regulatory Capital Adjustment and Deduction:
Add: Unrealized gains on AFS equity exposures includable in Tier 2 Capital 5—
Less: Minimum regulatory capital requirements of insurance underwriting subsidiaries (11) 229 279
Total Tier 2 Capital $ 22,326 $ 18,296
Total Capital (Tier 1 Capital + Tier 2 Capital) $198,746 $184,959