Citibank 2015 Annual Report Download - page 228
Download and view the complete annual report
Please find page 228 of the 2015 Citibank annual report below. You can navigate through the pages in the report by either clicking on the pages listed below, or by using the keyword search tool below to find specific information within the annual report.-
 1
1 -
2
-
3
-
4
-
5
-
6
-
7
-
8
-
9
-
10
-
11
-
12
-
13
-
14
-
15
-
16
-
17
-
18
-
19
-
20
-
21
-
22
-
23
-
24
-
25
-
26
-
27
-
28
-
29
-
30
-
31
-
32
-
33
-
34
-
35
-
36
-
37
-
38
-
39
-
40
-
41
-
42
-
43
-
44
-
45
-
46
-
47
-
48
-
49
-
50
-
51
-
52
-
53
-
54
-
55
-
56
-
57
-
58
-
59
-
60
-
61
-
62
-
63
-
64
-
65
-
66
-
67
-
68
-
69
-
70
-
71
-
72
-
73
-
74
-
75
-
76
-
77
-
78
-
79
-
80
-
81
-
82
-
83
-
84
-
85
-
86
-
87
-
88
-
89
-
90
-
91
-
92
-
93
-
94
-
95
-
96
-
97
-
98
-
99
-
100
-
101
-
102
-
103
-
104
-
105
-
106
-
107
-
108
-
109
-
110
-
111
-
112
-
113
-
114
-
115
-
116
-
117
-
118
-
119
-
120
-
121
-
122
-
123
-
124
-
125
-
126
-
127
-
128
-
129
-
130
-
131
-
132
-
133
-
134
-
135
-
136
-
137
-
138
-
139
-
140
-
141
-
142
-
143
-
144
-
145
-
146
-
147
-
148
-
149
-
150
-
151
-
152
-
153
-
154
-
155
-
156
-
157
-
158
-
159
-
160
-
161
-
162
-
163
-
164
-
165
-
166
-
167
-
168
-
169
-
170
-
171
-
172
-
173
-
174
-
175
-
176
-
177
-
178
-
179
-
180
-
181
-
182
-
183
-
184
-
185
-
186
-
187
-
188
-
189
-
190
-
191
-
192
-
193
-
194
-
195
-
196
-
197
-
198
-
199
-
200
-
201
-
202
-
203
-
204
-
205
-
206
-
207
-
208
-
209
-
210
-
211
-
212
-
213
-
214
-
215
-
216
-
217
-
 218
218 -
 219
219 -
 220
220 -
 221
221 -
 222
222 -
 223
223 -
 224
224 -
 225
225 -
 226
226 -
 227
227 -
 228
228 -
 229
229 -
 230
230 -
 231
231 -
 232
232 -
 233
233 -
 234
234 -
 235
235 -
 236
236 -
 237
237 -
 238
238 -
239
-
240
-
241
-
242
-
243
-
244
-
245
-
246
-
247
-
248
-
249
-
250
-
251
-
252
-
253
-
254
-
255
-
256
-
257
-
258
-
259
-
260
-
261
-
262
-
263
-
264
-
265
-
266
-
267
-
268
-
269
-
270
-
271
-
272
-
273
-
274
-
275
-
276
-
277
-
278
-
279
-
280
-
281
-
282
-
283
-
284
-
285
-
286
-
287
-
288
-
289
-
290
-
291
-
292
-
293
-
294
-
295
-
296
-
297
-
298
-
299
-
300
-
301
-
302
-
303
-
304
-
305
-
306
-
307
-
308
-
309
-
310
-
311
-
312
-
313
-
314
-
315
-
316
-
317
-
318
-
319
-
320
-
321
-
322
-
323
-
324
-
325
-
326
-
327
-
328
-
329
-
330
-
331
-
332
 |
 |

210
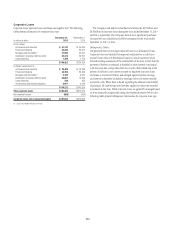
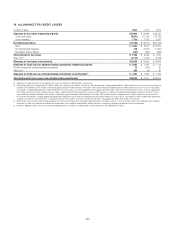
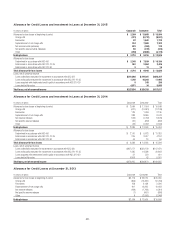
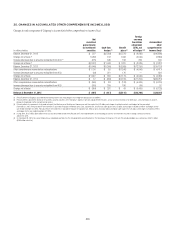
16. ALLOWANCE FOR CREDIT LOSSES
In millions of dollars 2015 2014 2013
Allowance for loan losses at beginning of period $15,994 $19,648 $ 25,455
Gross credit losses (9,041) (11,108) (12,769)
Gross recoveries(1) 1,739 2,135 2,306
Net credit losses (NCLs) $ (7,302) $ (8,973) $(10,463)
NCLs $ 7,302 $ 8,973 $ 10,463
Net reserve builds (releases) 139 (1,879) (1,961)
Net specific reserve releases (333) (266) (898)
Total provision for loan losses $ 7,108 $ 6,828 $ 7,604
Other, net (2)(3) (3,174) (1,509) (2,948)
Allowance for loan losses at end of period $12,626 $ 15,994 $ 19,648
Allowance for credit losses on unfunded lending commitments at beginning of period $ 1,063 $ 1,229 $ 1,119
Provision (release) for unfunded lending commitments 74 (162) 80
Other, net (3) 265 (4) 30
Allowance for credit losses on unfunded lending commitments at end of period (4) $ 1,402 $ 1,063 $ 1,229
Total allowance for loans, leases, and unfunded lending commitments $14,028 $ 17,057 $ 20,877
(1) Recoveries have been reduced by certain collection costs that are incurred only if collection efforts are successful.
(2) 2015 includes reductions of approximately $2.4 billion related to the sale or transfer to held-for-sale (HFS) of various loan portfolios, including approximately $1.5 billion related to the transfer of various real estate loan
portfolios to HFS. Additionally, 2015 includes a reduction of approximately $474 million related to FX translation. 2014 includes reductions of approximately $1.1 billion related to the sale or transfer to HFS of various
loan portfolios, including approximately $411 million related to the transfer of various real estate loan portfolios to HFS, approximately $204 million related to the transfer to HFS of a business in Greece, approximately
$177 million related to the transfer to HFS of a business in Spain, approximately $29 million related to the transfer to HFS of a business in Honduras, and approximately $108 million related to the transfer to HFS of
various EMEA loan portfolios. Additionally, 2014 includes a reduction of approximately $463 million related to FX translation. 2013 includes reductions of approximately $2.4 billion related to the sale or transfer to
HFS of various loan portfolios, including approximately $360 million related to the sale of Credicard and approximately $255 million related to a transfer to HFS of a loan portfolio in Greece, approximately $230 million
related to a non-provision transfer of reserves associated with deferred interest to other assets which includes deferred interest and approximately $220 million related to FX translation.
(3) 2015 includes a reclassification of $271 million of Allowance for Loan Losses to Allowance for Unfunded Lending Commitments, included in Other, net. This reclassification reflects the re-attribution of $271 million in
Allowances for Credit Losses between the funded and unfunded portions of the corporate credit portfolios and does not reflect a change in the underlying credit performance of these portfolios.
(4) Represents additional credit loss reserves for unfunded lending commitments and letters of credit recorded in Other liabilities on the Consolidated Balance Sheet.