Citibank 2015 Annual Report Download - page 280
Download and view the complete annual report
Please find page 280 of the 2015 Citibank annual report below. You can navigate through the pages in the report by either clicking on the pages listed below, or by using the keyword search tool below to find specific information within the annual report.-
 1
1 -
2
-
3
-
4
-
5
-
6
-
7
-
8
-
9
-
10
-
11
-
12
-
13
-
14
-
15
-
16
-
17
-
18
-
19
-
20
-
21
-
22
-
23
-
24
-
25
-
26
-
27
-
28
-
29
-
30
-
31
-
32
-
33
-
34
-
35
-
36
-
37
-
38
-
39
-
40
-
41
-
42
-
43
-
44
-
45
-
46
-
47
-
48
-
49
-
50
-
51
-
52
-
53
-
54
-
55
-
56
-
57
-
58
-
59
-
60
-
61
-
62
-
63
-
64
-
65
-
66
-
67
-
68
-
69
-
70
-
71
-
72
-
73
-
74
-
75
-
76
-
77
-
78
-
79
-
80
-
81
-
82
-
83
-
84
-
85
-
86
-
87
-
88
-
89
-
90
-
91
-
92
-
93
-
94
-
95
-
96
-
97
-
98
-
99
-
100
-
101
-
102
-
103
-
104
-
105
-
106
-
107
-
108
-
109
-
110
-
111
-
112
-
113
-
114
-
115
-
116
-
117
-
118
-
119
-
120
-
121
-
122
-
123
-
124
-
125
-
126
-
127
-
128
-
129
-
130
-
131
-
132
-
133
-
134
-
135
-
136
-
137
-
138
-
139
-
140
-
141
-
142
-
143
-
144
-
145
-
146
-
147
-
148
-
149
-
150
-
151
-
152
-
153
-
154
-
155
-
156
-
157
-
158
-
159
-
160
-
161
-
162
-
163
-
164
-
165
-
166
-
167
-
168
-
169
-
170
-
171
-
172
-
173
-
174
-
175
-
176
-
177
-
178
-
179
-
180
-
181
-
182
-
183
-
184
-
185
-
186
-
187
-
188
-
189
-
190
-
191
-
192
-
193
-
194
-
195
-
196
-
197
-
198
-
199
-
200
-
201
-
202
-
203
-
204
-
205
-
206
-
207
-
208
-
209
-
210
-
211
-
212
-
213
-
214
-
215
-
216
-
217
-
218
-
219
-
220
-
221
-
222
-
223
-
224
-
225
-
226
-
227
-
228
-
229
-
230
-
231
-
232
-
233
-
234
-
235
-
236
-
237
-
238
-
239
-
240
-
241
-
242
-
243
-
244
-
245
-
246
-
247
-
248
-
249
-
250
-
251
-
252
-
253
-
254
-
255
-
256
-
257
-
258
-
259
-
260
-
261
-
262
-
263
-
264
-
265
-
266
-
267
-
268
-
269
-
 270
270 -
 271
271 -
 272
272 -
 273
273 -
 274
274 -
 275
275 -
 276
276 -
 277
277 -
 278
278 -
 279
279 -
 280
280 -
 281
281 -
 282
282 -
 283
283 -
 284
284 -
 285
285 -
 286
286 -
 287
287 -
 288
288 -
 289
289 -
 290
290 -
291
-
292
-
293
-
294
-
295
-
296
-
297
-
298
-
299
-
300
-
301
-
302
-
303
-
304
-
305
-
306
-
307
-
308
-
309
-
310
-
311
-
312
-
313
-
314
-
315
-
316
-
317
-
318
-
319
-
320
-
321
-
322
-
323
-
324
-
325
-
326
-
327
-
328
-
329
-
330
-
331
-
332
 |
 |

262
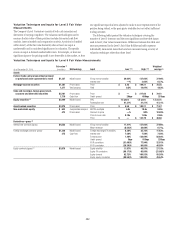
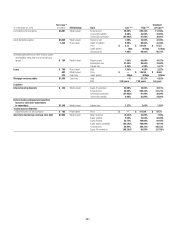
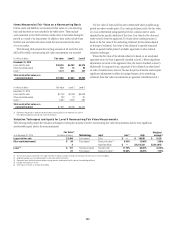
Valuation Techniques and Inputs for Level 3 Fair Value
Measurements
The Company’s Level 3 inventory consists of both cash securities and
derivatives of varying complexity. The valuation methodologies used to
measure the fair value of these positions include discounted cash flow
analysis, internal models and comparative analysis. A position is classified
within Level 3 of the fair value hierarchy when at least one input is
unobservable and is considered significant to its valuation. The specific
reason an input is deemed unobservable varies. For example, at least one
significant input to the pricing model is not observable in the market, at least
one significant input has been adjusted to make it more representative of the
position being valued, or the price quote available does not reflect sufficient
trading activities.
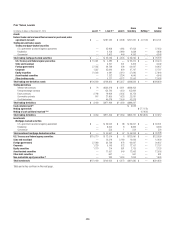
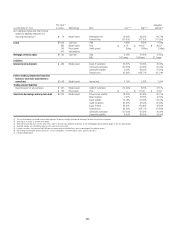
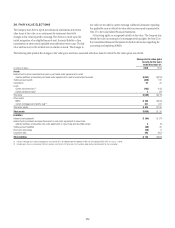
The following tables present the valuation techniques covering the
majority of Level 3 inventory and the most significant unobservable inputs
used in Level 3 fair value measurements. Differences between this table and
amounts presented in the Level 3 Fair Value Rollforward table represent
individually immaterial items that have been measured using a variety of
valuation techniques other than those listed.
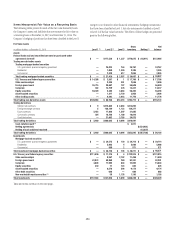
Valuation Techniques and Inputs for Level 3 Fair Value Measurements
As of December 31, 2015
Fair value (1)
Methodology Input Low (2)(3) High (2)(3)
Weighted
average (4)
(in millions)
Assets
Federal funds sold and securities borrowed
or purchased under agreements to resell $1,337 Model-based IR log-normal volatility 29.02% 137.02% 37.90%
Interest rate —% 2.03% 0.27%
Mortgage-backed securities $1,287 Price-based Price $ 3.45 $ 109.21 $ 78.25
1,377 Yield analysis Yield 0.5% 14.07% 4.83%
State and municipal, foreign government,
corporate and other debt securities $3,761 Price-based Price $ — $ 217.00 $ 79.41
1,719 Cash flow Credit spread 20bps 600bps 251bps
Equity securities (5) $3,499 Model-based WAL 1.5 years 1.5 years 1.5 years
Redemption rate 41.21% 41.21% 41.21%
Asset-backed securities $3,075 Price-based Price $ 5.55 $ 100.21 $ 71.57
Non-marketable equity $ 633 Comparables analysis EBITDA multiples 6.8x 10.8x 9.05x
473 Price-based Discount to price —% 90% 10.89%
Price-to-book ratio 0.19x 1.09x 0.60x
Price $ — $ 132.78 $ 46.66
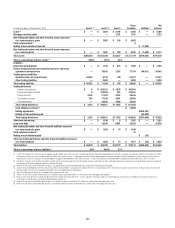
Derivatives—gross (6)
Interest rate contracts (gross) $4,553 Model-based IR log-normal volatility 17.41% 137.02% 37.60%
Mean reversion (5.52)% 20.00% 0.71%
Foreign exchange contracts (gross) $1,326 Model-based Foreign exchange (FX) volatility 0.38% 25.73% 11.63%
275 Cash flow Interest rate 7.50% 7.50% 7.50%
Forward price 1.48% 138.09% 56.80%
Credit spread 3bps 515bps 235bps
IR-IR correlation (51.00)% 77.94% 32.91%
IR-FX correlation (20.30)% 60.00% 48.85%
Equity contracts (gross) (7) $3,976 Model-based Equity volatility 11.87% 49.57% 27.33%
Equity-FX correlation (88.17)% 65.00% (21.09)%
Equity forward 82.72% 100.53% 95.20%
Equity-equity correlation (80.54)% 100.00% 49.54%