Citibank 2015 Annual Report Download - page 29
Download and view the complete annual report
Please find page 29 of the 2015 Citibank annual report below. You can navigate through the pages in the report by either clicking on the pages listed below, or by using the keyword search tool below to find specific information within the annual report.-
 1
1 -
2
-
3
-
4
-
5
-
6
-
7
-
8
-
9
-
10
-
11
-
12
-
13
-
14
-
15
-
16
-
17
-
18
-
 19
19 -
 20
20 -
 21
21 -
 22
22 -
 23
23 -
 24
24 -
 25
25 -
 26
26 -
 27
27 -
 28
28 -
 29
29 -
 30
30 -
 31
31 -
 32
32 -
 33
33 -
 34
34 -
 35
35 -
 36
36 -
 37
37 -
 38
38 -
 39
39 -
40
-
41
-
42
-
43
-
44
-
45
-
46
-
47
-
48
-
49
-
50
-
51
-
52
-
53
-
54
-
55
-
56
-
57
-
58
-
59
-
60
-
61
-
62
-
63
-
64
-
65
-
66
-
67
-
68
-
69
-
70
-
71
-
72
-
73
-
74
-
75
-
76
-
77
-
78
-
79
-
80
-
81
-
82
-
83
-
84
-
85
-
86
-
87
-
88
-
89
-
90
-
91
-
92
-
93
-
94
-
95
-
96
-
97
-
98
-
99
-
100
-
101
-
102
-
103
-
104
-
105
-
106
-
107
-
108
-
109
-
110
-
111
-
112
-
113
-
114
-
115
-
116
-
117
-
118
-
119
-
120
-
121
-
122
-
123
-
124
-
125
-
126
-
127
-
128
-
129
-
130
-
131
-
132
-
133
-
134
-
135
-
136
-
137
-
138
-
139
-
140
-
141
-
142
-
143
-
144
-
145
-
146
-
147
-
148
-
149
-
150
-
151
-
152
-
153
-
154
-
155
-
156
-
157
-
158
-
159
-
160
-
161
-
162
-
163
-
164
-
165
-
166
-
167
-
168
-
169
-
170
-
171
-
172
-
173
-
174
-
175
-
176
-
177
-
178
-
179
-
180
-
181
-
182
-
183
-
184
-
185
-
186
-
187
-
188
-
189
-
190
-
191
-
192
-
193
-
194
-
195
-
196
-
197
-
198
-
199
-
200
-
201
-
202
-
203
-
204
-
205
-
206
-
207
-
208
-
209
-
210
-
211
-
212
-
213
-
214
-
215
-
216
-
217
-
218
-
219
-
220
-
221
-
222
-
223
-
224
-
225
-
226
-
227
-
228
-
229
-
230
-
231
-
232
-
233
-
234
-
235
-
236
-
237
-
238
-
239
-
240
-
241
-
242
-
243
-
244
-
245
-
246
-
247
-
248
-
249
-
250
-
251
-
252
-
253
-
254
-
255
-
256
-
257
-
258
-
259
-
260
-
261
-
262
-
263
-
264
-
265
-
266
-
267
-
268
-
269
-
270
-
271
-
272
-
273
-
274
-
275
-
276
-
277
-
278
-
279
-
280
-
281
-
282
-
283
-
284
-
285
-
286
-
287
-
288
-
289
-
290
-
291
-
292
-
293
-
294
-
295
-
296
-
297
-
298
-
299
-
300
-
301
-
302
-
303
-
304
-
305
-
306
-
307
-
308
-
309
-
310
-
311
-
312
-
313
-
314
-
315
-
316
-
317
-
318
-
319
-
320
-
321
-
322
-
323
-
324
-
325
-
326
-
327
-
328
-
329
-
330
-
331
-
332
 |
 |

11
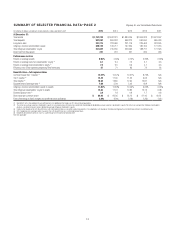
SUMMARY OF SELECTED FINANCIAL DATA—PAGE 2
In millions of dollars, except per-share amounts, ratios and direct staff 2015 2014 2013 2012 2011
At December 31:
Total assets $ 1,731,210 $1,842,181 $1,880,035 $1,864,328 $1,873,597
Total deposits 907,887 899,332 968,273 930,560 865,936
Long-term debt 201,275 223,080 221,116 239,463 323,505
Citigroup common stockholders’ equity 205,139 199,717 197,254 186,155 177,213
Total Citigroup stockholders’ equity 221,857 210,185 203,992 188,717 177,525
Direct staff (in thousands) 231 241 251 259 266
Performance metrics
Return on average assets 0.95% 0.39% 0.73% 0.39% 0.56%
Return on average common stockholders’ equity (2) 8.1 3.4 7.0 4.1 6.3
Return on average total stockholders’ equity (2) 7.9 3.5 6.9 4.1 6.3
Efficiency ratio (Total operating expenses/Total revenues) 57 71 63 72 65
Basel III ratios—full implementation
Common Equity Tier 1 Capital (3) 12.07% 10.57% 10.57% 8.72% N/A
Tier 1 Capital (3) 13.49 11.45 11.23 9.03 N/A
Total Capital (3) 15.30 12.80 12.64 10.81 N/A
Supplementary Leverage ratio (4) 7.08 5.94 5.42 N/A N/A
Citigroup common stockholders’ equity to assets 11.85% 10.84% 10.49% 9.99% 9.46%
Total Citigroup stockholders’ equity to assets 12.82 11.41 10.85 10.12 9.48
Dividend payout ratio (5) 3.0 1.8 0.9 1.7 0.8
Book value per common share $ 69.46 $ 66.05 $ 65.12 $ 61.46 $ 60.61
Ratio of earnings to fixed charges and preferred stock dividends 2.89x 2.00x 2.18x 1.39x 1.61x
(1) See Note 2 to the Consolidated Financial Statements for additional information on Citi’s discontinued operations.
(2) The return on average common stockholders’ equity is calculated using net income less preferred stock dividends divided by average common stockholders’ equity. The return on average total Citigroup stockholders’
equity is calculated using net income divided by average Citigroup stockholders’ equity.
(3) Capital ratios based on the U.S. Basel III rules, with full implementation assumed for capital components; risk-weighted assets based on the Advanced Approaches for determining total risk-weighted assets.
(4) Citi’s Supplementary Leverage ratio is based on the U.S. Basel III rules, on a fully implemented basis.
(5) Dividends declared per common share as a percentage of net income per diluted share.
N/A Not applicable
Citigroup Inc. and Consolidated Subsidiaries