Citibank 2015 Annual Report Download - page 25
Download and view the complete annual report
Please find page 25 of the 2015 Citibank annual report below. You can navigate through the pages in the report by either clicking on the pages listed below, or by using the keyword search tool below to find specific information within the annual report.-
 1
1 -
2
-
3
-
4
-
5
-
6
-
7
-
8
-
9
-
10
-
11
-
12
-
13
-
14
-
 15
15 -
 16
16 -
 17
17 -
 18
18 -
 19
19 -
 20
20 -
 21
21 -
 22
22 -
 23
23 -
 24
24 -
 25
25 -
 26
26 -
 27
27 -
 28
28 -
 29
29 -
 30
30 -
 31
31 -
 32
32 -
 33
33 -
 34
34 -
 35
35 -
36
-
37
-
38
-
39
-
40
-
41
-
42
-
43
-
44
-
45
-
46
-
47
-
48
-
49
-
50
-
51
-
52
-
53
-
54
-
55
-
56
-
57
-
58
-
59
-
60
-
61
-
62
-
63
-
64
-
65
-
66
-
67
-
68
-
69
-
70
-
71
-
72
-
73
-
74
-
75
-
76
-
77
-
78
-
79
-
80
-
81
-
82
-
83
-
84
-
85
-
86
-
87
-
88
-
89
-
90
-
91
-
92
-
93
-
94
-
95
-
96
-
97
-
98
-
99
-
100
-
101
-
102
-
103
-
104
-
105
-
106
-
107
-
108
-
109
-
110
-
111
-
112
-
113
-
114
-
115
-
116
-
117
-
118
-
119
-
120
-
121
-
122
-
123
-
124
-
125
-
126
-
127
-
128
-
129
-
130
-
131
-
132
-
133
-
134
-
135
-
136
-
137
-
138
-
139
-
140
-
141
-
142
-
143
-
144
-
145
-
146
-
147
-
148
-
149
-
150
-
151
-
152
-
153
-
154
-
155
-
156
-
157
-
158
-
159
-
160
-
161
-
162
-
163
-
164
-
165
-
166
-
167
-
168
-
169
-
170
-
171
-
172
-
173
-
174
-
175
-
176
-
177
-
178
-
179
-
180
-
181
-
182
-
183
-
184
-
185
-
186
-
187
-
188
-
189
-
190
-
191
-
192
-
193
-
194
-
195
-
196
-
197
-
198
-
199
-
200
-
201
-
202
-
203
-
204
-
205
-
206
-
207
-
208
-
209
-
210
-
211
-
212
-
213
-
214
-
215
-
216
-
217
-
218
-
219
-
220
-
221
-
222
-
223
-
224
-
225
-
226
-
227
-
228
-
229
-
230
-
231
-
232
-
233
-
234
-
235
-
236
-
237
-
238
-
239
-
240
-
241
-
242
-
243
-
244
-
245
-
246
-
247
-
248
-
249
-
250
-
251
-
252
-
253
-
254
-
255
-
256
-
257
-
258
-
259
-
260
-
261
-
262
-
263
-
264
-
265
-
266
-
267
-
268
-
269
-
270
-
271
-
272
-
273
-
274
-
275
-
276
-
277
-
278
-
279
-
280
-
281
-
282
-
283
-
284
-
285
-
286
-
287
-
288
-
289
-
290
-
291
-
292
-
293
-
294
-
295
-
296
-
297
-
298
-
299
-
300
-
301
-
302
-
303
-
304
-
305
-
306
-
307
-
308
-
309
-
310
-
311
-
312
-
313
-
314
-
315
-
316
-
317
-
318
-
319
-
320
-
321
-
322
-
323
-
324
-
325
-
326
-
327
-
328
-
329
-
330
-
331
-
332
 |
 |
7
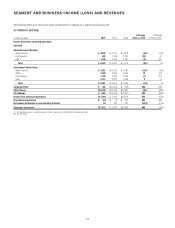
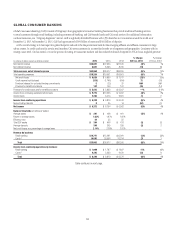
year, driven by an increase of 3% in both Citicorp and Citi Holdings’ revenues.
(Citi’s results of operations excluding the impact of FX translation are
non-GAAP financial measures. Citi believes the presentation of its results
of operations excluding the impact of FX translation provides a more
meaningful depiction for investors of the underlying fundamentals of
its businesses.)
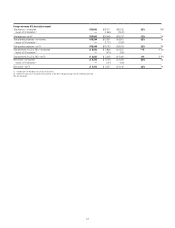
Expenses
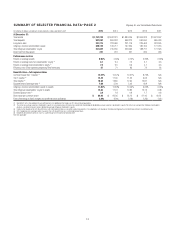
Citigroup expenses decreased 21% versus the prior year to $43.6 billion.
Excluding the impact of the mortgage settlement in the prior year, Citigroup
expenses declined 15% driven by significantly lower legal and related
expenses ($1.5 billion compared to $5.8 billion in the prior year) and
repositioning costs ($472 million compared to $1.6 billion in the prior
year), as well as the impact of FX translation (which lowered expenses by
approximately $2.6 billion in 2015 compared to the prior year). Excluding
the impact of both the mortgage settlement in the prior year and FX
translation, Citigroup’s expenses declined 10%, mainly driven by the lower
legal and related expenses and repositioning costs.
Excluding the impact of FX translation, which lowered reported expenses
by approximately $2.4 billion in 2015 compared to the prior year, Citicorp
expenses decreased 9% also driven by significantly lower legal and related
expenses and repositioning costs. Citicorp expenses in 2015 included legal
and related expenses of $1.1 billion, compared to $4.8 billion in the prior
year, and $278 million of repositioning costs, compared to $1.5 billion in the
prior year.
Citi Holdings’ expenses were $4.6 billion, down 52% from the prior year.
Excluding the impact of the mortgage settlement in the prior year, Citi
Holdings’ expenses decreased 22%, primarily driven by the ongoing decline
in Citi Holdings assets as well as lower legal and related expenses.
Credit Costs
Citi’s total provisions for credit losses and for benefits and claims of $7.9
billion increased 6% from the prior year. Excluding the impact of the
mortgage settlement in the prior year, Citi’s total provisions for credit losses
and for benefits and claims increased 7% as a lower net loan loss reserve
release was partially offset by lower net credit losses.
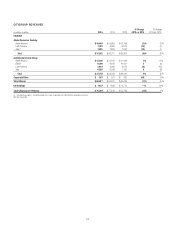
Net credit losses of $7.3 billion declined 19% versus the prior year.
Consumer net credit losses declined 19% to $7.1 billion, mostly reflecting
continued improvements in North America Citi-branded cards and Citi retail
services in Citicorp as well as the North America mortgage portfolio within
Citi Holdings. Corporate net credit losses declined 19% to $234 million.
As previously disclosed, corporate net credit losses in 2014 included
approximately $165 million of net credit losses related to the Pemex supplier
program in Mexico (for additional information, see “Institutional Clients
Group” below). Excluding these net credit losses in the prior year, net credit
losses increased by approximately $111 million, primarily related to a
limited number of energy and energy-related corporate loans, predominantly
incurred during the latter part of 2015 (for additional information, see
“Institutional Clients Group” and “Credit Risk—Corporate Credit” below).
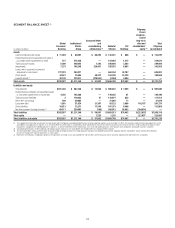
The net release of allowance for loan losses and unfunded lending
commitments was $120 million in 2015, compared to a $2.4 billion release
in 2014, excluding the impact of the mortgage settlement in the prior year.
Citicorp’s net reserve build was $409 million, compared to a net loan loss
reserve release of $1.4 billion in 2014. The build in 2015 was primarily driven
by net loan loss reserve builds in Institutional Clients Group (ICG) during
the latter part of 2015, including approximately $530 million for energy and
energy-related exposures. Overall, Citi expects its credit costs in Citicorp will
likely be higher in 2016 as compared to 2015 given that it believes the vast
majority of its net loan loss reserve releases have occurred as credit quality
has largely stabilized.
Citi Holdings’ net reserve release, excluding the impact of the mortgage
settlement in the prior year, decreased $443 million from the prior year
to $529 million, primarily reflecting lower net releases related to the
North America mortgage portfolio.
For additional information on Citi’s consumer and corporate credit costs
and allowance for loan losses, see “Credit Risk” below.
Capital
Citi continued to grow its regulatory capital during 2015, even as it returned
approximately $5.9 billion of capital to its shareholders in the form of
common stock repurchases and dividends. Citigroup’s Tier 1 Capital and
Common Equity Tier 1 Capital ratios, on a fully implemented basis, were
13.5% and 12.1% as of December 31, 2015, respectively, compared to 11.5%
and 10.6% as of December 31, 2014 (all based on the Basel III Advanced
Approaches for determining risk-weighted assets). Citigroup’s Supplementary
Leverage ratio as of December 31, 2015, on a fully implemented basis, was
7.1%, compared to 5.9% as of December 31, 2014. For additional information
on Citi’s capital ratios and related components, including the impact of Citi’s
DTAs on its capital ratios, see “Capital Resources” below.