Citibank 2015 Annual Report Download - page 179
Download and view the complete annual report
Please find page 179 of the 2015 Citibank annual report below. You can navigate through the pages in the report by either clicking on the pages listed below, or by using the keyword search tool below to find specific information within the annual report.-
 1
1 -
2
-
3
-
4
-
5
-
6
-
7
-
8
-
9
-
10
-
11
-
12
-
13
-
14
-
15
-
16
-
17
-
18
-
19
-
20
-
21
-
22
-
23
-
24
-
25
-
26
-
27
-
28
-
29
-
30
-
31
-
32
-
33
-
34
-
35
-
36
-
37
-
38
-
39
-
40
-
41
-
42
-
43
-
44
-
45
-
46
-
47
-
48
-
49
-
50
-
51
-
52
-
53
-
54
-
55
-
56
-
57
-
58
-
59
-
60
-
61
-
62
-
63
-
64
-
65
-
66
-
67
-
68
-
69
-
70
-
71
-
72
-
73
-
74
-
75
-
76
-
77
-
78
-
79
-
80
-
81
-
82
-
83
-
84
-
85
-
86
-
87
-
88
-
89
-
90
-
91
-
92
-
93
-
94
-
95
-
96
-
97
-
98
-
99
-
100
-
101
-
102
-
103
-
104
-
105
-
106
-
107
-
108
-
109
-
110
-
111
-
112
-
113
-
114
-
115
-
116
-
117
-
118
-
119
-
120
-
121
-
122
-
123
-
124
-
125
-
126
-
127
-
128
-
129
-
130
-
131
-
132
-
133
-
134
-
135
-
136
-
137
-
138
-
139
-
140
-
141
-
142
-
143
-
144
-
145
-
146
-
147
-
148
-
149
-
150
-
151
-
152
-
153
-
154
-
155
-
156
-
157
-
158
-
159
-
160
-
161
-
162
-
163
-
164
-
165
-
166
-
167
-
168
-
 169
169 -
 170
170 -
 171
171 -
 172
172 -
 173
173 -
 174
174 -
 175
175 -
 176
176 -
 177
177 -
 178
178 -
 179
179 -
 180
180 -
 181
181 -
 182
182 -
 183
183 -
 184
184 -
 185
185 -
 186
186 -
 187
187 -
 188
188 -
 189
189 -
190
-
191
-
192
-
193
-
194
-
195
-
196
-
197
-
198
-
199
-
200
-
201
-
202
-
203
-
204
-
205
-
206
-
207
-
208
-
209
-
210
-
211
-
212
-
213
-
214
-
215
-
216
-
217
-
218
-
219
-
220
-
221
-
222
-
223
-
224
-
225
-
226
-
227
-
228
-
229
-
230
-
231
-
232
-
233
-
234
-
235
-
236
-
237
-
238
-
239
-
240
-
241
-
242
-
243
-
244
-
245
-
246
-
247
-
248
-
249
-
250
-
251
-
252
-
253
-
254
-
255
-
256
-
257
-
258
-
259
-
260
-
261
-
262
-
263
-
264
-
265
-
266
-
267
-
268
-
269
-
270
-
271
-
272
-
273
-
274
-
275
-
276
-
277
-
278
-
279
-
280
-
281
-
282
-
283
-
284
-
285
-
286
-
287
-
288
-
289
-
290
-
291
-
292
-
293
-
294
-
295
-
296
-
297
-
298
-
299
-
300
-
301
-
302
-
303
-
304
-
305
-
306
-
307
-
308
-
309
-
310
-
311
-
312
-
313
-
314
-
315
-
316
-
317
-
318
-
319
-
320
-
321
-
322
-
323
-
324
-
325
-
326
-
327
-
328
-
329
-
330
-
331
-
332
 |
 |

161
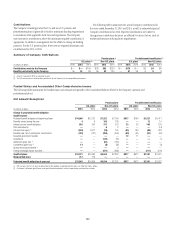
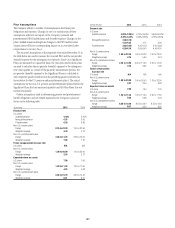
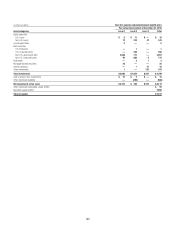
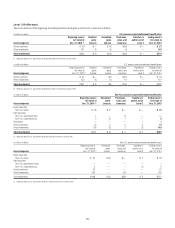
Pension plans Postretirement benefit plans
U.S. plans Non-U.S. plans U.S. plans Non-U.S. plans
In millions of dollars 2015 2014 2015 2014 2015 2014 2015 2014
Change in plan assets
Qualified plans
Plan assets at fair value at beginning of year $13,071 $12,731 $ 7,057 $ 6,918 $ 10 $ 32 $1,384 $1,472
Actual return on plan assets (183) 941 56 1,108 (1) 2(5) 166
Company contributions —100 134 230 235 56 912
Plan participants’ contributions ——5549 51 ——
Divestitures ——(131) (11) ————
Settlements ——(61) (184) ————
Benefits paid, net of government subsidy (751) (701) (299) (357) (127) (131) (57) (93)
Foreign exchange impact and other ——(657) (652) ——(198) (173)
Qualified plans $12,137 $13,071 $ 6,104 $ 7,057 $ 166 $ 10 $1,133 $1,384
Nonqualified plans — ———————
Plan assets at fair value at year end $12,137 $13,071 $ 6,104 $ 7,057 $ 166 $ 10 $1,133 $1,384
Funded status of the plans
Qualified plans (2) $ (1,094) $ (989) $ (430) $ (195) $(651) $(907) $ (158) $ (143)
Nonqualified plans (1) (712) (779) ——————
Funded status of the plans at year end $ (1,806) $ (1,768) $ (430) $ (195) $(651) $(907) $ (158) $ (143)
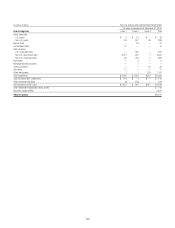
Net amount recognized
Qualified plans
Benefit asset $ — $ — $ 726 $ 921 $ — $ — $ 115 $ 196
Benefit liability (1,094) (989) (1,156) (1,116) (651) (907) (273) (339)
Qualified plans $ (1,094) $ (989) $ (430) $ (195) $(651) $(907) $ (158) $ (143)
Nonqualified plans (712) (779) ——————
Net amount recognized on the balance sheet $ (1,806) $ (1,768) $ (430) $ (195 ) $(651) $(907) $ (158) $ (143)
Amounts recognized in Accumulated other
comprehensive income (loss)
Qualified plans
Net transition obligation $ — $ — $ (1) $ (1) $ — $ — $ — $ —
Prior service benefit —3513 ——125 157
Net actuarial gain (loss) (6,107) (5,819) (1,613) (1,690) 3(56) (547) (658)
Qualified plans $ (6,107) $ (5,816) $(1,609) $(1,678) $ 3 $ (56) $ (422) $ (501)
Nonqualified plans (266) (325) ——————
Net amount recognized in equity (pretax) $ (6,373) $(6,141) $(1,609) $(6,678) $ 3 $ (56) $ (422) $ (501)
Accumulated benefit obligation
Qualified plans $13,226 $14,050 $ 6,049 $ 6,699 $ 817 $ 917 $1,291 $1,527
Nonqualified plans 706 771 ——————
Accumulated benefit obligation at year end $13,932 $14,821 $ 6,049 $ 6,699 $ 817 $ 917 $1,291 $1,527
(1) The nonqualified plans of the Company are unfunded.
(2) The U.S. qualified pension plan is fully funded under specified Employee Retirement Income Security Act (ERISA) funding rules as of January 1, 2016 and no minimum required funding is expected for 2016.