Citibank 2015 Annual Report Download - page 108
Download and view the complete annual report
Please find page 108 of the 2015 Citibank annual report below. You can navigate through the pages in the report by either clicking on the pages listed below, or by using the keyword search tool below to find specific information within the annual report.-
 1
1 -
2
-
3
-
4
-
5
-
6
-
7
-
8
-
9
-
10
-
11
-
12
-
13
-
14
-
15
-
16
-
17
-
18
-
19
-
20
-
21
-
22
-
23
-
24
-
25
-
26
-
27
-
28
-
29
-
30
-
31
-
32
-
33
-
34
-
35
-
36
-
37
-
38
-
39
-
40
-
41
-
42
-
43
-
44
-
45
-
46
-
47
-
48
-
49
-
50
-
51
-
52
-
53
-
54
-
55
-
56
-
57
-
58
-
59
-
60
-
61
-
62
-
63
-
64
-
65
-
66
-
67
-
68
-
69
-
70
-
71
-
72
-
73
-
74
-
75
-
76
-
77
-
78
-
79
-
80
-
81
-
82
-
83
-
84
-
85
-
86
-
87
-
88
-
89
-
90
-
91
-
92
-
93
-
94
-
95
-
96
-
97
-
 98
98 -
 99
99 -
 100
100 -
 101
101 -
 102
102 -
 103
103 -
 104
104 -
 105
105 -
 106
106 -
 107
107 -
 108
108 -
 109
109 -
 110
110 -
 111
111 -
 112
112 -
 113
113 -
 114
114 -
 115
115 -
 116
116 -
 117
117 -
 118
118 -
119
-
120
-
121
-
122
-
123
-
124
-
125
-
126
-
127
-
128
-
129
-
130
-
131
-
132
-
133
-
134
-
135
-
136
-
137
-
138
-
139
-
140
-
141
-
142
-
143
-
144
-
145
-
146
-
147
-
148
-
149
-
150
-
151
-
152
-
153
-
154
-
155
-
156
-
157
-
158
-
159
-
160
-
161
-
162
-
163
-
164
-
165
-
166
-
167
-
168
-
169
-
170
-
171
-
172
-
173
-
174
-
175
-
176
-
177
-
178
-
179
-
180
-
181
-
182
-
183
-
184
-
185
-
186
-
187
-
188
-
189
-
190
-
191
-
192
-
193
-
194
-
195
-
196
-
197
-
198
-
199
-
200
-
201
-
202
-
203
-
204
-
205
-
206
-
207
-
208
-
209
-
210
-
211
-
212
-
213
-
214
-
215
-
216
-
217
-
218
-
219
-
220
-
221
-
222
-
223
-
224
-
225
-
226
-
227
-
228
-
229
-
230
-
231
-
232
-
233
-
234
-
235
-
236
-
237
-
238
-
239
-
240
-
241
-
242
-
243
-
244
-
245
-
246
-
247
-
248
-
249
-
250
-
251
-
252
-
253
-
254
-
255
-
256
-
257
-
258
-
259
-
260
-
261
-
262
-
263
-
264
-
265
-
266
-
267
-
268
-
269
-
270
-
271
-
272
-
273
-
274
-
275
-
276
-
277
-
278
-
279
-
280
-
281
-
282
-
283
-
284
-
285
-
286
-
287
-
288
-
289
-
290
-
291
-
292
-
293
-
294
-
295
-
296
-
297
-
298
-
299
-
300
-
301
-
302
-
303
-
304
-
305
-
306
-
307
-
308
-
309
-
310
-
311
-
312
-
313
-
314
-
315
-
316
-
317
-
318
-
319
-
320
-
321
-
322
-
323
-
324
-
325
-
326
-
327
-
328
-
329
-
330
-
331
-
332
 |
 |

90
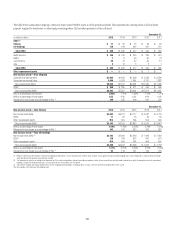
End-of-period deposits increased 1% year-over-year and remained
relatively unchanged quarter-over-quarter. Excluding the impact of FX
translation, Citigroup’s end-of-period deposits increased 4% year-over-year
and 1% sequentially, despite significant reductions in Citi Holdings deposits
from the prior-year period.
Excluding the impact of FX translation, Citicorp deposits grew 5% year-
over-year. Within Citicorp, GCB deposits increased 2% year-over-year, driven
by 5% growth in international deposits. ICG deposits increased 9% year-over-
year, with continued deposit growth in treasury and trade solutions and the
private bank.
The decline in Citi Holdings deposits from the prior-year period was
primarily driven by the now-complete transfer of Morgan Stanley Smith
Barney (MSSB) deposits to Morgan Stanley.
Citi monitors its deposit base across multiple dimensions, including what
Citi refers to as “LCR value” or the liquidity value of the deposit base under
the U.S. LCR rules (as discussed under “Short-Term Liquidity Measurement:
Liquidity Coverage Ratio (LCR)” below). Citi defines the liquidity value of
deposits as the percentage of deposits assumed to remain following a 30-day
period of liquidity stress. As discussed below, under the LCR rules, deposits are
assigned liquidity values based on expected behavior under stress, determined
by the type of deposit and the type of client. Generally, the LCR rules prioritize
transactional and operating accounts of consumers (including retail and
commercial banking deposits) and corporations respectively, while assigning
lower liquidity values to non-operating deposit balances of financial
institutions. As of December 31, 2015, Citi’s total deposits had an aggregate
liquidity value of approximately 73%, down slightly sequentially and
unchanged from December 31, 2014. Within the 73% total liquidity value as
of year-end 2015, Citi’s GCB deposits had a liquidity value of approximately
87% and ICG deposits, including Corporate/Other, had a liquidity value of
approximately 66%.
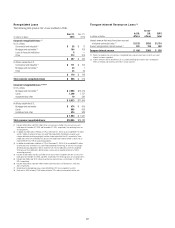
Long-Term Debt
Long-term debt (generally defined as debt with original maturities of one
year or more) represents the most significant component of Citi’s funding
for the parent entities and is a supplementary source of funding for the
bank entities.
Long-term debt is an important funding source due in part to its
multi-year contractual maturity structure. The weighted-average maturities
of unsecured long-term debt issued by Citigroup and its affiliates (including
Citibank) with a remaining life greater than one year (excluding remaining
trust preferred securities outstanding) was approximately 6.9 years as of
December 31, 2015, unchanged from the prior-year period and a slight
increase sequentially, due in part to the issuance of longer-dated debt
securities and the redemption of shorter-dated debt securities during the
fourth quarter of 2015.
Citi’s long-term debt outstanding at the parent includes senior and
subordinated debt and what Citi refers to as customer-related debt, consisting
of structured notes, such as equity- and credit-linked notes, as well as non-
structured notes. Citi’s issuance of customer-related debt is generally driven
by customer demand and supplements benchmark debt issuance as a source
of funding for Citi’s parent entities. Citi’s long-term debt at the bank also
includes FHLB advances and securitizations.
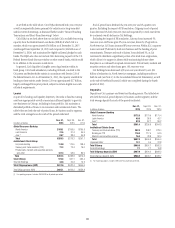
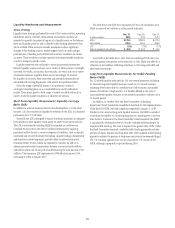
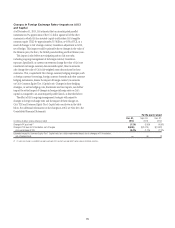
Long-Term Debt Outstanding
The following table sets forth Citi’s total long-term debt outstanding for the
periods indicated:
In billions of dollars
Dec. 31,
2015
Sept. 30,
2015
Dec. 31,
2014
Parent
Benchmark debt:
Senior debt $ 90.3 $ 99.5 $ 97.9
Subordinated debt 26.9 26.8 25.5
Trust preferred 1.7 1.7 1.7
Customer-related debt
Structured debt 21.8 23.1 22.3
Non-structured debt 3.0 3.6 5.9
Local country and other (1) 2.4 2.1 4.7
Total parent $146.1 $156.8 $158.0
Bank
FHLB borrowings $ 17.8 $ 17.3 $ 19.8
Securitizations (2) 30.9 32.0 38.1
Local country and other (1) 6.5 7.4 7.2
Total bank $ 55.2 $ 56.7 $ 65.1
Total long-term debt $201.3 $213.5 $223.1
Note: Amounts represent the current value of long-term debt on Citi’s Consolidated Balance Sheet which,
for certain debt instruments, includes consideration of fair value, hedging impacts and unamortized
discounts and premiums.
(1) Local country debt includes debt issued by Citi’s affiliates in support of their local operations.
(2) Predominantly credit card securitizations, primarily backed by Citi-branded credit card receivables.
Citi’s total long-term debt outstanding decreased both year-over-year
and quarter-over-quarter, primarily due to significant buybacks of senior
and subordinated debt at the parent level during the fourth quarter of 2015
(discussed below), as well as continued reductions in securitizations at the
bank entities.
As part of its liability management, Citi has considered, and may continue
to consider, opportunities to repurchase its long-term debt pursuant to
open market purchases, tender offers or other means. Such repurchases
help reduce Citi’s overall funding costs and assist it in meeting regulatory
changes and requirements. During 2015, Citi repurchased an aggregate of
approximately $21.1 billion of its outstanding long-term debt, including
early redemptions of FHLB advances. Of this amount, approximately
$11.5 billion was repurchased in the fourth quarter of 2015 as Citi completed
significant asset sales in Citi Holdings, including the OneMain Financial
business. Accordingly, while Citi anticipates continued liability management
activities in 2016, it does not currently expect repurchases to remain at the
level experienced in 2015.