Citibank 2015 Annual Report Download - page 97
Download and view the complete annual report
Please find page 97 of the 2015 Citibank annual report below. You can navigate through the pages in the report by either clicking on the pages listed below, or by using the keyword search tool below to find specific information within the annual report.-
 1
1 -
2
-
3
-
4
-
5
-
6
-
7
-
8
-
9
-
10
-
11
-
12
-
13
-
14
-
15
-
16
-
17
-
18
-
19
-
20
-
21
-
22
-
23
-
24
-
25
-
26
-
27
-
28
-
29
-
30
-
31
-
32
-
33
-
34
-
35
-
36
-
37
-
38
-
39
-
40
-
41
-
42
-
43
-
44
-
45
-
46
-
47
-
48
-
49
-
50
-
51
-
52
-
53
-
54
-
55
-
56
-
57
-
58
-
59
-
60
-
61
-
62
-
63
-
64
-
65
-
66
-
67
-
68
-
69
-
70
-
71
-
72
-
73
-
74
-
75
-
76
-
77
-
78
-
79
-
80
-
81
-
82
-
83
-
84
-
85
-
86
-
 87
87 -
 88
88 -
 89
89 -
 90
90 -
 91
91 -
 92
92 -
 93
93 -
 94
94 -
 95
95 -
 96
96 -
 97
97 -
 98
98 -
 99
99 -
 100
100 -
 101
101 -
 102
102 -
 103
103 -
 104
104 -
 105
105 -
 106
106 -
 107
107 -
108
-
109
-
110
-
111
-
112
-
113
-
114
-
115
-
116
-
117
-
118
-
119
-
120
-
121
-
122
-
123
-
124
-
125
-
126
-
127
-
128
-
129
-
130
-
131
-
132
-
133
-
134
-
135
-
136
-
137
-
138
-
139
-
140
-
141
-
142
-
143
-
144
-
145
-
146
-
147
-
148
-
149
-
150
-
151
-
152
-
153
-
154
-
155
-
156
-
157
-
158
-
159
-
160
-
161
-
162
-
163
-
164
-
165
-
166
-
167
-
168
-
169
-
170
-
171
-
172
-
173
-
174
-
175
-
176
-
177
-
178
-
179
-
180
-
181
-
182
-
183
-
184
-
185
-
186
-
187
-
188
-
189
-
190
-
191
-
192
-
193
-
194
-
195
-
196
-
197
-
198
-
199
-
200
-
201
-
202
-
203
-
204
-
205
-
206
-
207
-
208
-
209
-
210
-
211
-
212
-
213
-
214
-
215
-
216
-
217
-
218
-
219
-
220
-
221
-
222
-
223
-
224
-
225
-
226
-
227
-
228
-
229
-
230
-
231
-
232
-
233
-
234
-
235
-
236
-
237
-
238
-
239
-
240
-
241
-
242
-
243
-
244
-
245
-
246
-
247
-
248
-
249
-
250
-
251
-
252
-
253
-
254
-
255
-
256
-
257
-
258
-
259
-
260
-
261
-
262
-
263
-
264
-
265
-
266
-
267
-
268
-
269
-
270
-
271
-
272
-
273
-
274
-
275
-
276
-
277
-
278
-
279
-
280
-
281
-
282
-
283
-
284
-
285
-
286
-
287
-
288
-
289
-
290
-
291
-
292
-
293
-
294
-
295
-
296
-
297
-
298
-
299
-
300
-
301
-
302
-
303
-
304
-
305
-
306
-
307
-
308
-
309
-
310
-
311
-
312
-
313
-
314
-
315
-
316
-
317
-
318
-
319
-
320
-
321
-
322
-
323
-
324
-
325
-
326
-
327
-
328
-
329
-
330
-
331
-
332
 |
 |

79
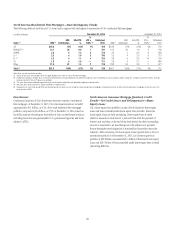
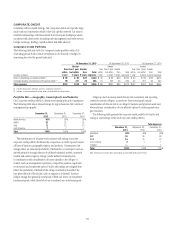
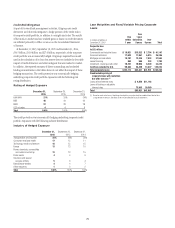
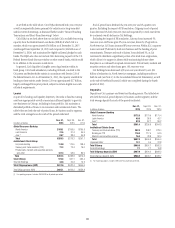
Credit Risk Mitigation
As part of its overall risk management activities, Citigroup uses credit
derivatives and other risk mitigants to hedge portions of the credit risk in
its corporate credit portfolio, in addition to outright asset sales. The results
of the mark-to-market and any realized gains or losses on credit derivatives
are reflected primarily in Other revenue on the Consolidated Statement
of Income.
At December 31, 2015, September 30, 2015 and December 31, 2014,
$34.5 billion, $33.0 billion and $27.6 billion, respectively, of the corporate
credit portfolio was economically hedged. Citigroup’s expected loss model
used in the calculation of its loan loss reserve does not include the favorable
impact of credit derivatives and other mitigants that are marked to market.
In addition, the reported amounts of direct outstandings and unfunded
lending commitments in the tables above do not reflect the impact of these
hedging transactions. The credit protection was economically hedging
underlying corporate credit portfolio exposures with the following risk
rating distribution:
Rating of Hedged Exposure
December 31,
2015
September 30,
2015
December 31,
2014
AAA/AA/A 21% 24% 24%
BBB 48 44 42
BB/B 27 28 28
CCC or below 44 6
Total 100% 100% 100%
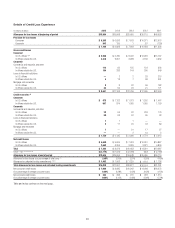
The credit protection was economically hedging underlying corporate credit
portfolio exposures with the following industry distribution:
Industry of Hedged Exposure
December 31,
2015
September 30,
2015
December 31,
2014
Transportation and industrial 28% 28% 30%
Consumer retail and health 17 15 11
Technology, media and telecom 16 15 15
Energy 13 13 10
Power, chemicals, commodities
and metals and mining 12 13 15
Public sector 44 6
Insurance and special
purpose entities 56 4
Banks/broker-dealers 44 7
Other industries 12 2
Total 100% 100% 100%
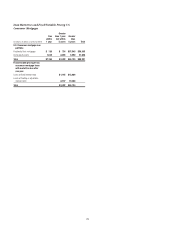
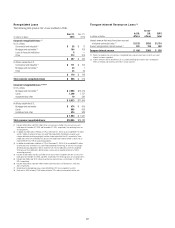
Loan Maturities and Fixed/Variable Pricing Corporate
Loans
In millions of dollars at
December 31, 2015
Due
within
1 year
Over
1 year
but within
5 years
Over
5 years Total
Corporate loan
In U.S. offices
Commercial and industrial loans $ 19,921 $13,522 $ 7,704 $ 41,147
Financial institutions 17,620 11,961 6,815 36,396
Mortgage and real estate 18,187 12,345 7,033 37,565
Lease financing 862 585 333 1,780
Installment, revolving credit, other 16,157 10,968 6,249 33,374
In offices outside the U.S. 90,365 34,440 13,427 138,232
Total corporate loans $163,112 $83,821 $41,561 $288,494
Fixed/variable pricing of
corporate loans with maturities
due after one year (1)
Loans at fixed interest rates $ 9,858 $11,192
Loans at floating or adjustable
interest rates 73,963 30,369
Total $83,821 $41,561
(1) Based on contractual terms. Repricing characteristics may effectively be modified from time to time
using derivative contracts. See Note 23 to the Consolidated Financial Statements.