Citibank 2015 Annual Report Download - page 150
Download and view the complete annual report
Please find page 150 of the 2015 Citibank annual report below. You can navigate through the pages in the report by either clicking on the pages listed below, or by using the keyword search tool below to find specific information within the annual report.-
 1
1 -
2
-
3
-
4
-
5
-
6
-
7
-
8
-
9
-
10
-
11
-
12
-
13
-
14
-
15
-
16
-
17
-
18
-
19
-
20
-
21
-
22
-
23
-
24
-
25
-
26
-
27
-
28
-
29
-
30
-
31
-
32
-
33
-
34
-
35
-
36
-
37
-
38
-
39
-
40
-
41
-
42
-
43
-
44
-
45
-
46
-
47
-
48
-
49
-
50
-
51
-
52
-
53
-
54
-
55
-
56
-
57
-
58
-
59
-
60
-
61
-
62
-
63
-
64
-
65
-
66
-
67
-
68
-
69
-
70
-
71
-
72
-
73
-
74
-
75
-
76
-
77
-
78
-
79
-
80
-
81
-
82
-
83
-
84
-
85
-
86
-
87
-
88
-
89
-
90
-
91
-
92
-
93
-
94
-
95
-
96
-
97
-
98
-
99
-
100
-
101
-
102
-
103
-
104
-
105
-
106
-
107
-
108
-
109
-
110
-
111
-
112
-
113
-
114
-
115
-
116
-
117
-
118
-
119
-
120
-
121
-
122
-
123
-
124
-
125
-
126
-
127
-
128
-
129
-
130
-
131
-
132
-
133
-
134
-
135
-
136
-
137
-
138
-
139
-
 140
140 -
 141
141 -
 142
142 -
 143
143 -
 144
144 -
 145
145 -
 146
146 -
 147
147 -
 148
148 -
 149
149 -
 150
150 -
 151
151 -
 152
152 -
 153
153 -
 154
154 -
 155
155 -
 156
156 -
 157
157 -
 158
158 -
 159
159 -
 160
160 -
161
-
162
-
163
-
164
-
165
-
166
-
167
-
168
-
169
-
170
-
171
-
172
-
173
-
174
-
175
-
176
-
177
-
178
-
179
-
180
-
181
-
182
-
183
-
184
-
185
-
186
-
187
-
188
-
189
-
190
-
191
-
192
-
193
-
194
-
195
-
196
-
197
-
198
-
199
-
200
-
201
-
202
-
203
-
204
-
205
-
206
-
207
-
208
-
209
-
210
-
211
-
212
-
213
-
214
-
215
-
216
-
217
-
218
-
219
-
220
-
221
-
222
-
223
-
224
-
225
-
226
-
227
-
228
-
229
-
230
-
231
-
232
-
233
-
234
-
235
-
236
-
237
-
238
-
239
-
240
-
241
-
242
-
243
-
244
-
245
-
246
-
247
-
248
-
249
-
250
-
251
-
252
-
253
-
254
-
255
-
256
-
257
-
258
-
259
-
260
-
261
-
262
-
263
-
264
-
265
-
266
-
267
-
268
-
269
-
270
-
271
-
272
-
273
-
274
-
275
-
276
-
277
-
278
-
279
-
280
-
281
-
282
-
283
-
284
-
285
-
286
-
287
-
288
-
289
-
290
-
291
-
292
-
293
-
294
-
295
-
296
-
297
-
298
-
299
-
300
-
301
-
302
-
303
-
304
-
305
-
306
-
307
-
308
-
309
-
310
-
311
-
312
-
313
-
314
-
315
-
316
-
317
-
318
-
319
-
320
-
321
-
322
-
323
-
324
-
325
-
326
-
327
-
328
-
329
-
330
-
331
-
332
 |
 |
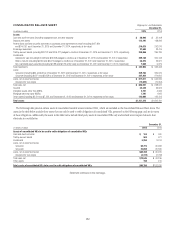
132
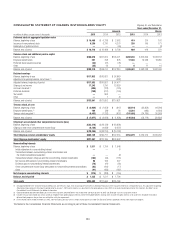
CONSOLIDATED BALANCE SHEET Citigroup Inc. and Subsidiaries
December 31,
In millions of dollars 2015 2014
Assets
Cash and due from banks (including segregated cash and other deposits) $ 20,900 $ 32,108
Deposits with banks 112,197 128,089
Federal funds sold and securities borrowed or purchased under agreements to resell (including $137,964
and $144,191 as of December 31, 2015 and December 31, 2014, respectively, at fair value) 219,675 242,570
Brokerage receivables 27,683 28,419
Trading account assets (including $92,123 and $106,217 pledged to creditors at December 31, 2015 and December 31, 2014, respectively) 249,956 296,786
Investments:
Available for sale (including $10,698 and $13,808 pledged to creditors as of December 31, 2015 and December 31, 2014, respectively) 299,136 300,143
Held to maturity (including $3,630 and $2,974 pledged to creditors as of December 31, 2015 and December 31, 2014, respectively) 36,215 23,921
Non-marketable equity securities (including $2,088 and $2,758 at fair value as of December 31, 2015 and December 31, 2014, respectively) 7,604 9,379
Total investments $ 342,955 $ 333,443
Loans:
Consumer (including $34 and $43 as of December 31, 2015 and December 31, 2014, respectively, at fair value) 329,783 369,970
Corporate (including $4,971 and $5,858 as of December 31, 2015 and December 31, 2014, respectively, at fair value) 287,834 274,665
Loans, net of unearned income $ 617,617 $ 644,635
Allowance for loan losses (12,626) (15,994)
Total loans, net $ 604,991 $ 628,641
Goodwill 22,349 23,592
Intangible assets (other than MSRs) 3,721 4,566
Mortgage servicing rights (MSRs) 1,781 1,845
Other assets (including $6,121 and $7,762 as of December 31, 2015 and December 31, 2014, respectively, at fair value) 125,002 122,122
Total assets $1,731,210 $1,842,181
The following table presents certain assets of consolidated variable interest entities (VIEs), which are included in the Consolidated Balance Sheet above. The
assets in the table below include those assets that can only be used to settle obligations of consolidated VIEs, presented on the following page, and are in excess
of those obligations. Additionally, the assets in the table below include third-party assets of consolidated VIEs only and exclude intercompany balances that
eliminate in consolidation.
December 31,
In millions of dollars 2015 2014
Assets of consolidated VIEs to be used to settle obligations of consolidated VIEs
Cash and due from banks $ 153 $ 300
Trading account assets 583 671
Investments 5,263 8,014
Loans, net of unearned income
Consumer 58,772 66,383
Corporate 22,008 29,596
Loans, net of unearned income $80,780 $ 95,979
Allowance for loan losses (2,135) (2,793)
Total loans, net $78,645 $ 93,186
Other assets 150 619
Total assets of consolidated VIEs to be used to settle obligations of consolidated VIEs $84,794 $102,790
Statement continues on the next page.