Citibank 2015 Annual Report Download - page 279
Download and view the complete annual report
Please find page 279 of the 2015 Citibank annual report below. You can navigate through the pages in the report by either clicking on the pages listed below, or by using the keyword search tool below to find specific information within the annual report.-
 1
1 -
2
-
3
-
4
-
5
-
6
-
7
-
8
-
9
-
10
-
11
-
12
-
13
-
14
-
15
-
16
-
17
-
18
-
19
-
20
-
21
-
22
-
23
-
24
-
25
-
26
-
27
-
28
-
29
-
30
-
31
-
32
-
33
-
34
-
35
-
36
-
37
-
38
-
39
-
40
-
41
-
42
-
43
-
44
-
45
-
46
-
47
-
48
-
49
-
50
-
51
-
52
-
53
-
54
-
55
-
56
-
57
-
58
-
59
-
60
-
61
-
62
-
63
-
64
-
65
-
66
-
67
-
68
-
69
-
70
-
71
-
72
-
73
-
74
-
75
-
76
-
77
-
78
-
79
-
80
-
81
-
82
-
83
-
84
-
85
-
86
-
87
-
88
-
89
-
90
-
91
-
92
-
93
-
94
-
95
-
96
-
97
-
98
-
99
-
100
-
101
-
102
-
103
-
104
-
105
-
106
-
107
-
108
-
109
-
110
-
111
-
112
-
113
-
114
-
115
-
116
-
117
-
118
-
119
-
120
-
121
-
122
-
123
-
124
-
125
-
126
-
127
-
128
-
129
-
130
-
131
-
132
-
133
-
134
-
135
-
136
-
137
-
138
-
139
-
140
-
141
-
142
-
143
-
144
-
145
-
146
-
147
-
148
-
149
-
150
-
151
-
152
-
153
-
154
-
155
-
156
-
157
-
158
-
159
-
160
-
161
-
162
-
163
-
164
-
165
-
166
-
167
-
168
-
169
-
170
-
171
-
172
-
173
-
174
-
175
-
176
-
177
-
178
-
179
-
180
-
181
-
182
-
183
-
184
-
185
-
186
-
187
-
188
-
189
-
190
-
191
-
192
-
193
-
194
-
195
-
196
-
197
-
198
-
199
-
200
-
201
-
202
-
203
-
204
-
205
-
206
-
207
-
208
-
209
-
210
-
211
-
212
-
213
-
214
-
215
-
216
-
217
-
218
-
219
-
220
-
221
-
222
-
223
-
224
-
225
-
226
-
227
-
228
-
229
-
230
-
231
-
232
-
233
-
234
-
235
-
236
-
237
-
238
-
239
-
240
-
241
-
242
-
243
-
244
-
245
-
246
-
247
-
248
-
249
-
250
-
251
-
252
-
253
-
254
-
255
-
256
-
257
-
258
-
259
-
260
-
261
-
262
-
263
-
264
-
265
-
266
-
267
-
268
-
 269
269 -
 270
270 -
 271
271 -
 272
272 -
 273
273 -
 274
274 -
 275
275 -
 276
276 -
 277
277 -
 278
278 -
 279
279 -
 280
280 -
 281
281 -
 282
282 -
 283
283 -
 284
284 -
 285
285 -
 286
286 -
 287
287 -
 288
288 -
 289
289 -
290
-
291
-
292
-
293
-
294
-
295
-
296
-
297
-
298
-
299
-
300
-
301
-
302
-
303
-
304
-
305
-
306
-
307
-
308
-
309
-
310
-
311
-
312
-
313
-
314
-
315
-
316
-
317
-
318
-
319
-
320
-
321
-
322
-
323
-
324
-
325
-
326
-
327
-
328
-
329
-
330
-
331
-
332
 |
 |

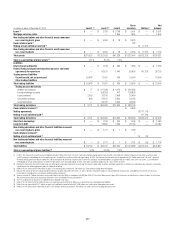
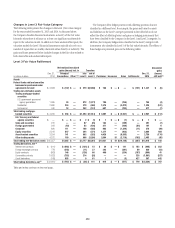
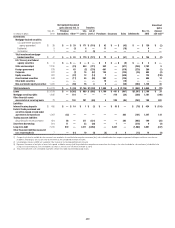
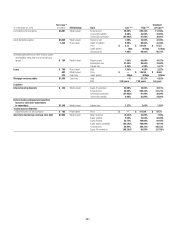
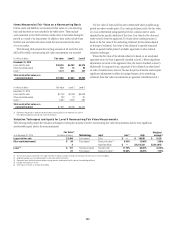
261
In millions of dollars
Dec. 31,
2013
Net realized/unrealized
gains (losses) incl. in Transfers
Purchases Issuances Sales Settlements
Dec. 31,
2014
Unrealized
gains
(losses)
still held (3)
Principal
transactions Other (1)(2)
into
Level 3
out of
Level 3
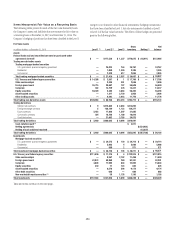
Loans $ 4,143 $ — $(233) $ 92 $ 6 $ 951 $ 197 $ (895) $(1,153) $ 3,108 $ 37
Mortgage servicing rights 2,718 — (390) — — — 217 (317) (383) 1,845 (390)
Other financial assets measured on
a recurring basis 181 — 100 (83) — 3 178 (18) (283) 78 14
Liabilities
Interest-bearing deposits $ 890 $ — $ 357 $ 5 $ (12) $ — $ 127 $ — $ (167) $ 486 $ (69)
Federal funds purchased and
securities loaned or sold under
agreements to repurchase 902 (6) — 54 — 78 — 220 (217) 1,043 (34)
Trading account liabilities
Securities sold, not yet purchased 590 (81) — 79 (111) — — 534 (749) 424 (58)
Short-term borrowings 29 (31) — 323 (12) — 49 — (76) 344 (8)
Long-term debt 7,621 109 49 2,701 (4,206) — 3,893 — (2,561) 7,290 (446)
Other financial liabilities measured
on a recurring basis 10 — (5) 7 (3) (2) 1 (3) (8) 7 (4)
(1) Changes in fair value of available-for-sale investments are recorded in Accumulated other comprehensive income (loss), unless related to other-than-temporary impairment, while gains and losses from sales are
recorded in Realized gains (losses) from sales of investments on the Consolidated Statement of Income.
(2) Unrealized gains (losses) on MSRs are recorded in Other revenue on the Consolidated Statement of Income.
(3) Represents the amount of total gains or losses for the period, included in earnings (and Accumulated other comprehensive income (loss) for changes in fair value of available-for-sale investments), attributable to the
change in fair value relating to assets and liabilities classified as Level 3 that are still held at December 31, 2014.
(4) Total Level 3 derivative assets and liabilities have been netted in these tables for presentation purposes only.
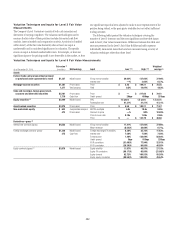
Level 3 Fair Value Rollforward
The following were the significant Level 3 transfers for the period
December 31, 2014 to December 31, 2015:
• Transfers of Federal Funds sold and securities borrowed or purchased
under agreements to resell of $2.9 billion from Level 3 to Level 2 related
to shortening of the remaining tenor of certain reverse repos. There is
more transparency and observability for repo curves used in the valuation
of structured reverse repos with tenors up to five years; thus, these
positions are generally classified as Level 2.
• Transfers of U.S. government-sponsored agency guaranteed MBS in
Trading account assets of $0.9 billion from Level 2 to Level 3, and
of $1.3 billion from Level 3 to Level 2 primarily related to changes in
observability due to market trading activity.
• Transfers of other trading assets of $1.0 billion from Level 2 to Level 3,
and of $3.3 billion from Level 3 to Level 2 primarily related to trading
loans for which there were changes in volume of and transparency into
market quotations.
• Transfers of Long-term debt of $2.3 billion from Level 2 to Level 3, and
of $4.0 billion from Level 3 to Level 2, mainly related to structured debt,
reflecting certain unobservable inputs becoming less significant and
certain underlying market inputs being more observable.
The following were the significant Level 3 transfers for the period
December 31, 2013 to December 31, 2014:
• Transfers of Long-term debt of $2.7 billion from Level 2 to Level 3, and
of $4.2 billion from Level 3 to Level 2, mainly related to structured debt,
reflecting changes in the significance of unobservable inputs as well as
certain underlying market inputs becoming less or more observable.
• Transfers of other trading assets of $2.6 billion from Level 2 to Level 3,
and of $2.3 billion from Level 3 to Level 2, related to trading loans,
reflecting changes in the volume of market quotations.