Citibank 2015 Annual Report Download - page 185
Download and view the complete annual report
Please find page 185 of the 2015 Citibank annual report below. You can navigate through the pages in the report by either clicking on the pages listed below, or by using the keyword search tool below to find specific information within the annual report.-
 1
1 -
2
-
3
-
4
-
5
-
6
-
7
-
8
-
9
-
10
-
11
-
12
-
13
-
14
-
15
-
16
-
17
-
18
-
19
-
20
-
21
-
22
-
23
-
24
-
25
-
26
-
27
-
28
-
29
-
30
-
31
-
32
-
33
-
34
-
35
-
36
-
37
-
38
-
39
-
40
-
41
-
42
-
43
-
44
-
45
-
46
-
47
-
48
-
49
-
50
-
51
-
52
-
53
-
54
-
55
-
56
-
57
-
58
-
59
-
60
-
61
-
62
-
63
-
64
-
65
-
66
-
67
-
68
-
69
-
70
-
71
-
72
-
73
-
74
-
75
-
76
-
77
-
78
-
79
-
80
-
81
-
82
-
83
-
84
-
85
-
86
-
87
-
88
-
89
-
90
-
91
-
92
-
93
-
94
-
95
-
96
-
97
-
98
-
99
-
100
-
101
-
102
-
103
-
104
-
105
-
106
-
107
-
108
-
109
-
110
-
111
-
112
-
113
-
114
-
115
-
116
-
117
-
118
-
119
-
120
-
121
-
122
-
123
-
124
-
125
-
126
-
127
-
128
-
129
-
130
-
131
-
132
-
133
-
134
-
135
-
136
-
137
-
138
-
139
-
140
-
141
-
142
-
143
-
144
-
145
-
146
-
147
-
148
-
149
-
150
-
151
-
152
-
153
-
154
-
155
-
156
-
157
-
158
-
159
-
160
-
161
-
162
-
163
-
164
-
165
-
166
-
167
-
168
-
169
-
170
-
171
-
172
-
173
-
174
-
 175
175 -
 176
176 -
 177
177 -
 178
178 -
 179
179 -
 180
180 -
 181
181 -
 182
182 -
 183
183 -
 184
184 -
 185
185 -
 186
186 -
 187
187 -
 188
188 -
 189
189 -
 190
190 -
 191
191 -
 192
192 -
 193
193 -
 194
194 -
 195
195 -
196
-
197
-
198
-
199
-
200
-
201
-
202
-
203
-
204
-
205
-
206
-
207
-
208
-
209
-
210
-
211
-
212
-
213
-
214
-
215
-
216
-
217
-
218
-
219
-
220
-
221
-
222
-
223
-
224
-
225
-
226
-
227
-
228
-
229
-
230
-
231
-
232
-
233
-
234
-
235
-
236
-
237
-
238
-
239
-
240
-
241
-
242
-
243
-
244
-
245
-
246
-
247
-
248
-
249
-
250
-
251
-
252
-
253
-
254
-
255
-
256
-
257
-
258
-
259
-
260
-
261
-
262
-
263
-
264
-
265
-
266
-
267
-
268
-
269
-
270
-
271
-
272
-
273
-
274
-
275
-
276
-
277
-
278
-
279
-
280
-
281
-
282
-
283
-
284
-
285
-
286
-
287
-
288
-
289
-
290
-
291
-
292
-
293
-
294
-
295
-
296
-
297
-
298
-
299
-
300
-
301
-
302
-
303
-
304
-
305
-
306
-
307
-
308
-
309
-
310
-
311
-
312
-
313
-
314
-
315
-
316
-
317
-
318
-
319
-
320
-
321
-
322
-
323
-
324
-
325
-
326
-
327
-
328
-
329
-
330
-
331
-
332
 |
 |

167
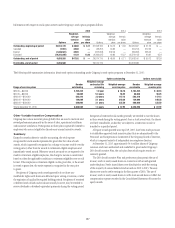
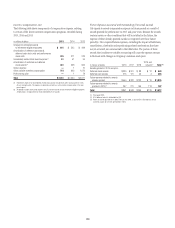
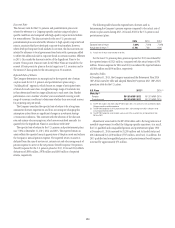
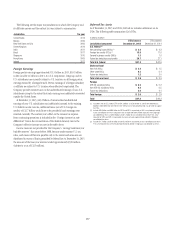
Fair Value Disclosure
For information on fair value measurements, including descriptions of
Levels 1, 2 and 3 of the fair value hierarchy and the valuation methodology
utilized by the Company, see Note 1 and Note 25 to the Consolidated
Financial Statements. ASU 2015-07 removes the current requirement to
categorize investments for which fair value is measured using the NAV
per share practical expedient within the fair value hierarchy.
Certain investments may transfer between the fair value hierarchy
classifications during the year due to changes in valuation methodology and
pricing sources. There were no significant transfers of investments between
Level 1 and Level 2 during 2015 and 2014.
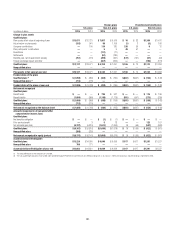
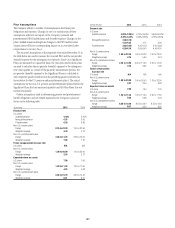
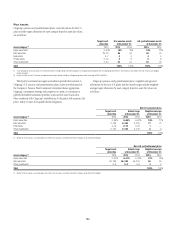
Plan assets by detailed asset categories and the fair value hierarchy are
as follows:
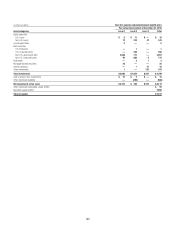
In millions of dollars U.S. pension and postretirement benefit plans (1)
Fair value measurement at December 31, 2015
Asset categories Level 1 Level 2 Level 3 Total
Equity securities
U.S. equity $ 694 $ — $ — $ 694
Non-U.S. equity 816 — — 816
Mutual funds 223 — — 223
Debt securities
U.S. Treasuries 1,172 — — 1,172
U.S. agency — 105 — 105
U.S. corporate bonds — 1,681 — 1,681
Non-U.S. government debt — 309 — 309
Non-U.S. corporate bonds — 440 — 440
State and municipal debt — 124 — 124
Asset-backed securities — 42 — 42
Mortgage-backed securities — 60 — 60
Annuity contracts — — 27 27
Derivatives 6 521 — 527
Other investments — — 147 147
Total investments $2,911 $ 3,282 $ 174 $ 6,367
Cash and short-term investments $ 138 $ 1,064 $ — $ 1,202
Other investment liabilities (10) (515) — (525)
Net investments at fair value $ 3,039 $ 3,831 $ 174 $ 7,044
Other investment receivables valued at NAV $ 18
Securities valued at NAV 5,241
Total net assets $12,303
(1) The investments of the U.S. pension and postretirement plans are commingled in one trust. At December 31, 2015, the allocable interests of the U.S. pension and postretirement plans were 98.6% and 1.4%, respectively.