Citibank 2015 Annual Report Download - page 248
Download and view the complete annual report
Please find page 248 of the 2015 Citibank annual report below. You can navigate through the pages in the report by either clicking on the pages listed below, or by using the keyword search tool below to find specific information within the annual report.-
 1
1 -
2
-
3
-
4
-
5
-
6
-
7
-
8
-
9
-
10
-
11
-
12
-
13
-
14
-
15
-
16
-
17
-
18
-
19
-
20
-
21
-
22
-
23
-
24
-
25
-
26
-
27
-
28
-
29
-
30
-
31
-
32
-
33
-
34
-
35
-
36
-
37
-
38
-
39
-
40
-
41
-
42
-
43
-
44
-
45
-
46
-
47
-
48
-
49
-
50
-
51
-
52
-
53
-
54
-
55
-
56
-
57
-
58
-
59
-
60
-
61
-
62
-
63
-
64
-
65
-
66
-
67
-
68
-
69
-
70
-
71
-
72
-
73
-
74
-
75
-
76
-
77
-
78
-
79
-
80
-
81
-
82
-
83
-
84
-
85
-
86
-
87
-
88
-
89
-
90
-
91
-
92
-
93
-
94
-
95
-
96
-
97
-
98
-
99
-
100
-
101
-
102
-
103
-
104
-
105
-
106
-
107
-
108
-
109
-
110
-
111
-
112
-
113
-
114
-
115
-
116
-
117
-
118
-
119
-
120
-
121
-
122
-
123
-
124
-
125
-
126
-
127
-
128
-
129
-
130
-
131
-
132
-
133
-
134
-
135
-
136
-
137
-
138
-
139
-
140
-
141
-
142
-
143
-
144
-
145
-
146
-
147
-
148
-
149
-
150
-
151
-
152
-
153
-
154
-
155
-
156
-
157
-
158
-
159
-
160
-
161
-
162
-
163
-
164
-
165
-
166
-
167
-
168
-
169
-
170
-
171
-
172
-
173
-
174
-
175
-
176
-
177
-
178
-
179
-
180
-
181
-
182
-
183
-
184
-
185
-
186
-
187
-
188
-
189
-
190
-
191
-
192
-
193
-
194
-
195
-
196
-
197
-
198
-
199
-
200
-
201
-
202
-
203
-
204
-
205
-
206
-
207
-
208
-
209
-
210
-
211
-
212
-
213
-
214
-
215
-
216
-
217
-
218
-
219
-
220
-
221
-
222
-
223
-
224
-
225
-
226
-
227
-
228
-
229
-
230
-
231
-
232
-
233
-
234
-
235
-
236
-
237
-
 238
238 -
 239
239 -
 240
240 -
 241
241 -
 242
242 -
 243
243 -
 244
244 -
 245
245 -
 246
246 -
 247
247 -
 248
248 -
 249
249 -
 250
250 -
 251
251 -
 252
252 -
 253
253 -
 254
254 -
 255
255 -
 256
256 -
 257
257 -
 258
258 -
259
-
260
-
261
-
262
-
263
-
264
-
265
-
266
-
267
-
268
-
269
-
270
-
271
-
272
-
273
-
274
-
275
-
276
-
277
-
278
-
279
-
280
-
281
-
282
-
283
-
284
-
285
-
286
-
287
-
288
-
289
-
290
-
291
-
292
-
293
-
294
-
295
-
296
-
297
-
298
-
299
-
300
-
301
-
302
-
303
-
304
-
305
-
306
-
307
-
308
-
309
-
310
-
311
-
312
-
313
-
314
-
315
-
316
-
317
-
318
-
319
-
320
-
321
-
322
-
323
-
324
-
325
-
326
-
327
-
328
-
329
-
330
-
331
-
332
 |
 |

230
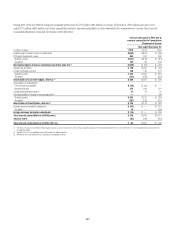
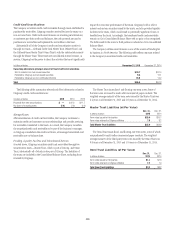
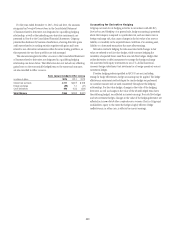
The fair value of the MSRs is primarily affected by changes in
prepayments of mortgages that result from shifts in mortgage interest rates.
Specifically, higher interest rates tend to lead to declining prepayments,
which causes the fair value of the MSRs to increase. In managing this risk,
the Company economically hedges a significant portion of the value of its
MSRs through the use of interest rate derivative contracts, forward purchase
and sale commitments of mortgage-backed securities and purchased
securities all classified as Trading account assets. The Company receives fees
during the course of servicing previously securitized mortgages. The amounts
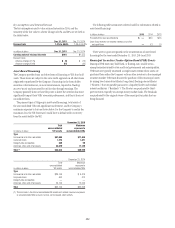
of these fees were as follows:
In millions of dollars 2015 2014 2013
Servicing fees $552 $638 $800
Late fees 16 25 42
Ancillary fees 31 56 100
Total MSR fees $599 $719 $942
These fees and changes in MSR fair values are classified in the
Consolidated Statement of Income as Other revenue.
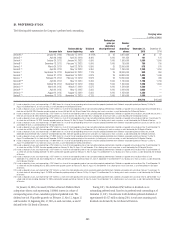
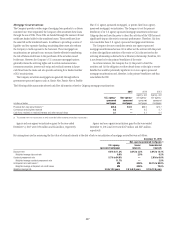
Re-Securitizations
The Company engages in re-securitization transactions in which debt
securities are transferred to a VIE in exchange for new beneficial interests.
During the years ended December 31, 2015 and 2014, Citi transferred non-
agency (private-label) securities with an original par value of approximately
$885 million and $1.2 billion, respectively, to re-securitization entities. These
securities are backed by either residential or commercial mortgages and are
often structured on behalf of clients.
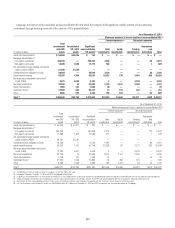
As of December 31, 2015, the fair value of Citi-retained interests in
private-label re-securitization transactions structured by Citi totaled
approximately $428 million (including $132 million related to re-
securitization transactions executed in 2015), which has been recorded
in Trading account assets. Of this amount, approximately $18 million
was related to senior beneficial interests and approximately $410 million
was related to subordinated beneficial interests. As of December 31, 2014,
the fair value of Citi-retained interests in private-label re-securitization
transactions structured by Citi totaled approximately $545 million (including
$194 million related to re-securitization transactions executed in 2014). Of
this amount, approximately $133 million was related to senior beneficial
interests, and approximately $412 million was related to subordinated
beneficial interests. The original par value of private-label re-securitization
transactions in which Citi holds a retained interest as of December 31, 2015
and 2014 was approximately $3.7 billion and $5.1 billion, respectively.
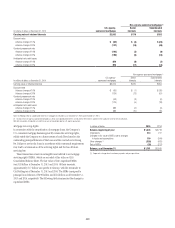
The Company also re-securitizes U.S. government-agency guaranteed
mortgage-backed (agency) securities. During the years ended December 31,
2015 and 2014, Citi transferred agency securities with a fair value
of approximately $17.8 billion and $22.5 billion, respectively, to
re-securitization entities.
As of December 31, 2015, the fair value of Citi-retained interests in agency
re-securitization transactions structured by Citi totaled approximately
$1.8 billion (including $1.5 billion related to re-securitization transactions
executed in 2015) compared to $1.8 billion as of December 31, 2014
(including $1.5 billion related to re-securitization transactions executed in
2014), which is recorded in Trading account assets. The original fair value
of agency re-securitization transactions in which Citi holds a retained interest
as of December 31, 2015 and 2014 was approximately $65.0 billion and
$73.0 billion, respectively.
As of December 31, 2015 and 2014, the Company did not consolidate any
private-label or agency re-securitization entities.
Citi-Administered Asset-Backed Commercial Paper Conduits
The Company is active in the asset-backed commercial paper conduit
business as administrator of several multi-seller commercial paper conduits
and also as a service provider to single-seller and other commercial paper
conduits sponsored by third parties.
Citi’s multi-seller commercial paper conduits are designed to provide
the Company’s clients access to low-cost funding in the commercial paper
markets. The conduits purchase assets from or provide financing facilities to
clients and are funded by issuing commercial paper to third-party investors.
The conduits generally do not purchase assets originated by the Company.
The funding of the conduits is facilitated by the liquidity support and credit
enhancements provided by the Company.
As administrator to Citi’s conduits, the Company is generally responsible
for selecting and structuring assets purchased or financed by the conduits,
making decisions regarding the funding of the conduits, including
determining the tenor and other features of the commercial paper issued,
monitoring the quality and performance of the conduits’ assets, and
facilitating the operations and cash flows of the conduits. In return, the
Company earns structuring fees from customers for individual transactions
and earns an administration fee from the conduit, which is equal to the
income from the client program and liquidity fees of the conduit after
payment of conduit expenses. This administration fee is fairly stable, since
most risks and rewards of the underlying assets are passed back to the clients.
Once the asset pricing is negotiated, most ongoing income, costs and fees are
relatively stable as a percentage of the conduit’s size.
The conduits administered by the Company do not generally invest
in liquid securities that are formally rated by third parties. The assets are
privately negotiated and structured transactions that are generally designed
to be held by the conduit, rather than actively traded and sold. The yield
earned by the conduit on each asset is generally tied to the rate on the
commercial paper issued by the conduit, thus passing interest rate risk to the
client. Each asset purchased by the conduit is structured with transaction-
specific credit enhancement features provided by the third-party client seller,
including over collateralization, cash and excess spread collateral accounts,
direct recourse or third-party guarantees. These credit enhancements are
sized with the objective of approximating a credit rating of A or above, based