Citibank 2015 Annual Report Download - page 59
Download and view the complete annual report
Please find page 59 of the 2015 Citibank annual report below. You can navigate through the pages in the report by either clicking on the pages listed below, or by using the keyword search tool below to find specific information within the annual report.-
 1
1 -
2
-
3
-
4
-
5
-
6
-
7
-
8
-
9
-
10
-
11
-
12
-
13
-
14
-
15
-
16
-
17
-
18
-
19
-
20
-
21
-
22
-
23
-
24
-
25
-
26
-
27
-
28
-
29
-
30
-
31
-
32
-
33
-
34
-
35
-
36
-
37
-
38
-
39
-
40
-
41
-
42
-
43
-
44
-
45
-
46
-
47
-
48
-
 49
49 -
 50
50 -
 51
51 -
 52
52 -
 53
53 -
 54
54 -
 55
55 -
 56
56 -
 57
57 -
 58
58 -
 59
59 -
 60
60 -
 61
61 -
 62
62 -
 63
63 -
 64
64 -
 65
65 -
 66
66 -
 67
67 -
 68
68 -
 69
69 -
70
-
71
-
72
-
73
-
74
-
75
-
76
-
77
-
78
-
79
-
80
-
81
-
82
-
83
-
84
-
85
-
86
-
87
-
88
-
89
-
90
-
91
-
92
-
93
-
94
-
95
-
96
-
97
-
98
-
99
-
100
-
101
-
102
-
103
-
104
-
105
-
106
-
107
-
108
-
109
-
110
-
111
-
112
-
113
-
114
-
115
-
116
-
117
-
118
-
119
-
120
-
121
-
122
-
123
-
124
-
125
-
126
-
127
-
128
-
129
-
130
-
131
-
132
-
133
-
134
-
135
-
136
-
137
-
138
-
139
-
140
-
141
-
142
-
143
-
144
-
145
-
146
-
147
-
148
-
149
-
150
-
151
-
152
-
153
-
154
-
155
-
156
-
157
-
158
-
159
-
160
-
161
-
162
-
163
-
164
-
165
-
166
-
167
-
168
-
169
-
170
-
171
-
172
-
173
-
174
-
175
-
176
-
177
-
178
-
179
-
180
-
181
-
182
-
183
-
184
-
185
-
186
-
187
-
188
-
189
-
190
-
191
-
192
-
193
-
194
-
195
-
196
-
197
-
198
-
199
-
200
-
201
-
202
-
203
-
204
-
205
-
206
-
207
-
208
-
209
-
210
-
211
-
212
-
213
-
214
-
215
-
216
-
217
-
218
-
219
-
220
-
221
-
222
-
223
-
224
-
225
-
226
-
227
-
228
-
229
-
230
-
231
-
232
-
233
-
234
-
235
-
236
-
237
-
238
-
239
-
240
-
241
-
242
-
243
-
244
-
245
-
246
-
247
-
248
-
249
-
250
-
251
-
252
-
253
-
254
-
255
-
256
-
257
-
258
-
259
-
260
-
261
-
262
-
263
-
264
-
265
-
266
-
267
-
268
-
269
-
270
-
271
-
272
-
273
-
274
-
275
-
276
-
277
-
278
-
279
-
280
-
281
-
282
-
283
-
284
-
285
-
286
-
287
-
288
-
289
-
290
-
291
-
292
-
293
-
294
-
295
-
296
-
297
-
298
-
299
-
300
-
301
-
302
-
303
-
304
-
305
-
306
-
307
-
308
-
309
-
310
-
311
-
312
-
313
-
314
-
315
-
316
-
317
-
318
-
319
-
320
-
321
-
322
-
323
-
324
-
325
-
326
-
327
-
328
-
329
-
330
-
331
-
332
 |
 |

41
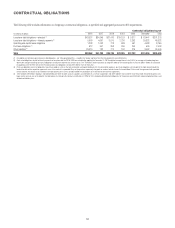
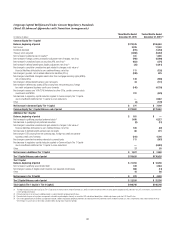
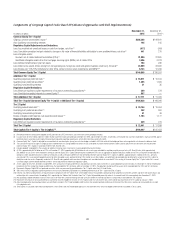
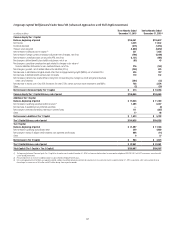
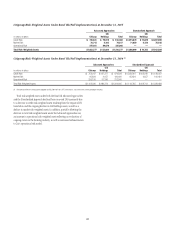
Citigroup Risk-Weighted Assets Rollforward Under Current Regulatory Standards
(Basel III Advanced Approaches with Transition Arrangements)
In millions of dollars
Three Months Ended
December 31, 2015
Twelve Months Ended
December 31, 2015 (1)
Total Risk-Weighted Assets, beginning of period $1,229,667 $1,274,672
Changes in Credit Risk-Weighted Assets
Net decrease in retail exposures (2) (13,856) (26,399)
Net increase in wholesale exposures (3) 1,668 1,682
Net decrease in repo-style transactions (935) (2,015)
Net decrease in securitization exposures (1,843) (2,563)
Net increase in equity exposures 1,129 1,603
Net decrease in over-the-counter (OTC) derivatives (4) (3,119) (7,002)
Net decrease in derivatives CVA (5) (789) (4,418)
Net decrease in other exposures (6) (9,464) (27,793)
Net decrease in supervisory 6% multiplier (7) (1,585) (3,750)
Net decrease in Credit Risk-Weighted Assets $ (28,794) $ (70,655)
Changes in Market Risk-Weighted Assets
Net decrease in risk levels (8) $ (7,662) $ (21,041)
Net decrease due to model and methodology updates (9) (2,358) (4,623)
Net decrease in Market Risk-Weighted Assets $ (10,020) $ (25,664)
Increase in Operational Risk-Weighted Assets (10) $ — $ 12,500
Total Risk-Weighted Assets, end of period $1,190,853 $1,190,853
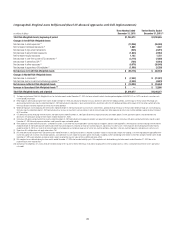
(1) The beginning balance of Total Risk-Weighted Assets for the twelve months ended December 31, 2015 has been restated to reflect the retrospective adoption of ASU 2014-01 for LIHTC investments, consistent with
current period presentation.
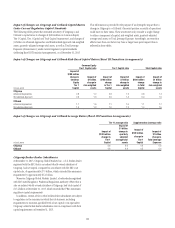
(2) Retail exposures decreased during the three months ended December 31, 2015 primarily due to reductions in loans, divestitures within the Citi Holdings portfolio, and the impact of FX translation. Retail exposures
decreased during the twelve months ended December 31, 2015 primarily due to reductions in loans and commitments, divestitures within the Citi Holdings portfolio and the impact of FX translation, partially offset by
the reclassification from other exposures of certain non-material portfolios.
(3) Wholesale exposures increased during the three months ended December 31, 2015 primarily due to an increase in commitments, partially offset by the impact of FX translation. Wholesale exposures increased during
the twelve months ended December 31, 2015 primarily due to an increase in investments and commitments and the reclassification from other exposures of certain non-material portfolios, largely offset by the impact
of FX translation.
(4) OTC derivatives decreased during the three months and twelve months ended December 31, 2015 primarily driven by exposure reduction and model updates. Further, parameter updates also contributed to the
decrease in OTC derivatives during the three months ended December 31, 2015.
(5) Derivatives CVA decreased during the three months ended December 31, 2015 primarily driven by exposure reduction and parameter and model updates. Derivatives CVA decreased during the twelve months ended
December 31, 2015 driven by exposure reduction, credit spread changes and model updates.
(6) Other exposures include cleared transactions, unsettled transactions, assets other than those reportable in specific exposure categories and non-material portfolios. Other exposures decreased during the three months
ended December 31, 2015 primarily due to decreased cleared transaction exposures, reduction of retail non-material exposures and decreases in other assets. Other exposures decreased during the twelve months
ended December 31, 2015 as a result of the reclassification to retail exposures and wholesale exposures of certain non-material portfolios, reduction in retail non-material exposures, and decreases in other assets.
(7) Supervisory 6% multiplier does not apply to derivatives CVA.
(8) Risk levels decreased during the three and twelve months ended December 31, 2015 primarily due to a reduction in positions subject to securitization charges, the ongoing assessment regarding the applicability of the
market risk capital rules to certain securitization positions, and a decrease in assets subject to standard specific risk charges. In addition, further contributing to the decline in risk levels during the twelve months ended
December 31, 2015 were reductions in exposure levels subject to comprehensive risk, Value at Risk, and Stressed Value at Risk.
(9) Risk-weighted assets declined during the three months ended December 31, 2015 due to model volatility inputs. Risk-weighted assets declined during the twelve months ended December 31, 2015 due to the
implementation of the “Volcker Rule.”
(10) Operational risk-weighted assets increased by $12.5 billion during the first quarter of 2015, reflecting an evaluation of ongoing events in the banking industry as well as continued enhancements to Citi’s operational
risk model.