Citibank 2015 Annual Report Download - page 39
Download and view the complete annual report
Please find page 39 of the 2015 Citibank annual report below. You can navigate through the pages in the report by either clicking on the pages listed below, or by using the keyword search tool below to find specific information within the annual report.-
 1
1 -
2
-
3
-
4
-
5
-
6
-
7
-
8
-
9
-
10
-
11
-
12
-
13
-
14
-
15
-
16
-
17
-
18
-
19
-
20
-
21
-
22
-
23
-
24
-
25
-
26
-
27
-
28
-
 29
29 -
 30
30 -
 31
31 -
 32
32 -
 33
33 -
 34
34 -
 35
35 -
 36
36 -
 37
37 -
 38
38 -
 39
39 -
 40
40 -
 41
41 -
 42
42 -
 43
43 -
 44
44 -
 45
45 -
 46
46 -
 47
47 -
 48
48 -
 49
49 -
50
-
51
-
52
-
53
-
54
-
55
-
56
-
57
-
58
-
59
-
60
-
61
-
62
-
63
-
64
-
65
-
66
-
67
-
68
-
69
-
70
-
71
-
72
-
73
-
74
-
75
-
76
-
77
-
78
-
79
-
80
-
81
-
82
-
83
-
84
-
85
-
86
-
87
-
88
-
89
-
90
-
91
-
92
-
93
-
94
-
95
-
96
-
97
-
98
-
99
-
100
-
101
-
102
-
103
-
104
-
105
-
106
-
107
-
108
-
109
-
110
-
111
-
112
-
113
-
114
-
115
-
116
-
117
-
118
-
119
-
120
-
121
-
122
-
123
-
124
-
125
-
126
-
127
-
128
-
129
-
130
-
131
-
132
-
133
-
134
-
135
-
136
-
137
-
138
-
139
-
140
-
141
-
142
-
143
-
144
-
145
-
146
-
147
-
148
-
149
-
150
-
151
-
152
-
153
-
154
-
155
-
156
-
157
-
158
-
159
-
160
-
161
-
162
-
163
-
164
-
165
-
166
-
167
-
168
-
169
-
170
-
171
-
172
-
173
-
174
-
175
-
176
-
177
-
178
-
179
-
180
-
181
-
182
-
183
-
184
-
185
-
186
-
187
-
188
-
189
-
190
-
191
-
192
-
193
-
194
-
195
-
196
-
197
-
198
-
199
-
200
-
201
-
202
-
203
-
204
-
205
-
206
-
207
-
208
-
209
-
210
-
211
-
212
-
213
-
214
-
215
-
216
-
217
-
218
-
219
-
220
-
221
-
222
-
223
-
224
-
225
-
226
-
227
-
228
-
229
-
230
-
231
-
232
-
233
-
234
-
235
-
236
-
237
-
238
-
239
-
240
-
241
-
242
-
243
-
244
-
245
-
246
-
247
-
248
-
249
-
250
-
251
-
252
-
253
-
254
-
255
-
256
-
257
-
258
-
259
-
260
-
261
-
262
-
263
-
264
-
265
-
266
-
267
-
268
-
269
-
270
-
271
-
272
-
273
-
274
-
275
-
276
-
277
-
278
-
279
-
280
-
281
-
282
-
283
-
284
-
285
-
286
-
287
-
288
-
289
-
290
-
291
-
292
-
293
-
294
-
295
-
296
-
297
-
298
-
299
-
300
-
301
-
302
-
303
-
304
-
305
-
306
-
307
-
308
-
309
-
310
-
311
-
312
-
313
-
314
-
315
-
316
-
317
-
318
-
319
-
320
-
321
-
322
-
323
-
324
-
325
-
326
-
327
-
328
-
329
-
330
-
331
-
332
 |
 |
21
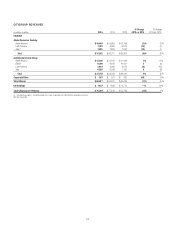
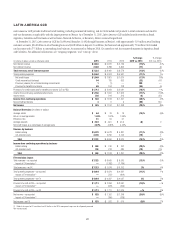
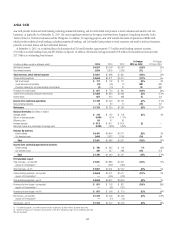
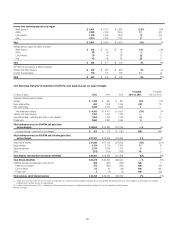
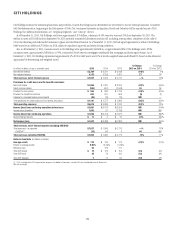
The discussion of the results of operations for Latin America GCB below excludes the impact of FX translation for all periods presented. Presentations of
the results of operations, excluding the impact of FX translation, are non-GAAP financial measures. For a reconciliation of certain of these metrics to
the reported results, see the table above.
2015 vs. 2014
Net income decreased 5% as higher expenses were partially offset by
higher revenues.
Revenues increased 3%, primarily due to the approximately $180 million
gain on sale in the third quarter of 2015 related to the Mexico merchant
acquiring business. Excluding this gain, revenues increased 1% as the impact
of modest volume growth was mostly offset by the absence of gains and
revenues from businesses divested in 2014, including as a result of the sale
of the Honduras consumer business in the second quarter and the partial
sale of Citi’s indirect investment in Banco de Chile in the first quarter, as well
as continued spread compression in cards. Revenues were also impacted by
continued slow economic growth in the region during 2015.
Retail banking revenues increased 6%, excluding the gain on sale related
to the merchant acquiring business and the business divestitures in 2014.
This increase in retail banking revenues reflected volume growth, including
an increase in average loans (4%) and average deposits (5%), partially
offset by a decline in investment sales (15%). Cards revenues decreased 2%,
primarily due to higher payment rates in Mexico resulting from the business’
focus on higher credit quality customers, consistent with GCB’s strategy, as
well as muted volumes (low purchase sales growth and unchanged average
loans). Cards revenues were also negatively impacted by ongoing shifts in
consumer behavior, including due to the previously-disclosed regulatory
reforms enacted in 2013 in Mexico. Latin America GCB expects the cards
payment rate in Mexico to remain elevated in 2016.
Expenses increased 5%, primarily due to higher regulatory and
compliance costs, higher technology spending and mandatory salary
increases in certain countries, partially offset by lower repositioning charges,
lower legal and related costs and ongoing efficiency savings.
Provisions were unchanged as higher net credit losses were partially
offset by a lower net loan loss reserve build. Net credit losses increased 1%,
largely reflecting portfolio growth as well as net credit losses incurred in the
commercial banking portfolio in the fourth quarter of 2015 associated with
a wind-down portfolio in Brazil, most of which was offset by the release of
previously-established loan loss reserves. The higher net credit losses were
partially offset by the absence of a $71 million charge-off in the fourth
quarter of 2014 related to Citi’s homebuilder exposure in Mexico. The net
loan loss reserve build declined 13%, primarily due to lower builds related to
Mexico cards, partially offset by higher builds related to Brazil in the second
half of 2015, as well as the absence of the releases related to the Mexico
homebuilder exposure in 2014.
Argentina/Venezuela
For additional information on Citi’s exposures and risks in Argentina and
Venezuela, see “Managing Global Risk—Country Risk” below.
2014 vs. 2013
Net income increased 7% as higher revenues were partially offset by higher
expenses and credit costs.
Revenues increased 4%, primarily due to volume growth and spread and
fee growth in Mexico, partially offset by continued spread compression in
the region and slower overall economic growth in certain Latin America
markets, including Mexico and Brazil during 2014. Retail banking revenues
increased 3% as average loans increased 6%, investment sales increased 25%
and average deposits increased 6%, partially offset by lower spreads in Brazil
and Colombia. Cards revenues increased 8% as average loans increased
5% and purchase sales increased 1%, excluding the impact of Credicard’s
results in the prior-year period (for additional information, see Note 2 to
the Consolidated Financial Statements). The increase in cards revenues was
partially offset by lower economic growth and slowing cards purchase sales
in Mexico due to the regulatory reforms enacted during 2013, as referenced
above.
Expenses increased 5%, primarily due to mandatory salary increases in
certain countries, higher legal and related costs, increased repositioning
charges and higher technology spending, partially offset by productivity and
repositioning savings.
Provisions increased 5%, primarily due to higher net credit losses, which
were partially offset by a lower loan loss reserve build. Net credit losses
increased 22%, driven by portfolio growth and continued seasoning in the
Mexico cards portfolio. Net credit losses were also impacted by both the
slower economic growth and regulatory reforms in Mexico as well as the
$71 million charge-off related to Citi’s homebuilder exposure in Mexico.