Citibank 2015 Annual Report Download - page 153
Download and view the complete annual report
Please find page 153 of the 2015 Citibank annual report below. You can navigate through the pages in the report by either clicking on the pages listed below, or by using the keyword search tool below to find specific information within the annual report.-
 1
1 -
2
-
3
-
4
-
5
-
6
-
7
-
8
-
9
-
10
-
11
-
12
-
13
-
14
-
15
-
16
-
17
-
18
-
19
-
20
-
21
-
22
-
23
-
24
-
25
-
26
-
27
-
28
-
29
-
30
-
31
-
32
-
33
-
34
-
35
-
36
-
37
-
38
-
39
-
40
-
41
-
42
-
43
-
44
-
45
-
46
-
47
-
48
-
49
-
50
-
51
-
52
-
53
-
54
-
55
-
56
-
57
-
58
-
59
-
60
-
61
-
62
-
63
-
64
-
65
-
66
-
67
-
68
-
69
-
70
-
71
-
72
-
73
-
74
-
75
-
76
-
77
-
78
-
79
-
80
-
81
-
82
-
83
-
84
-
85
-
86
-
87
-
88
-
89
-
90
-
91
-
92
-
93
-
94
-
95
-
96
-
97
-
98
-
99
-
100
-
101
-
102
-
103
-
104
-
105
-
106
-
107
-
108
-
109
-
110
-
111
-
112
-
113
-
114
-
115
-
116
-
117
-
118
-
119
-
120
-
121
-
122
-
123
-
124
-
125
-
126
-
127
-
128
-
129
-
130
-
131
-
132
-
133
-
134
-
135
-
136
-
137
-
138
-
139
-
140
-
141
-
142
-
 143
143 -
 144
144 -
 145
145 -
 146
146 -
 147
147 -
 148
148 -
 149
149 -
 150
150 -
 151
151 -
 152
152 -
 153
153 -
 154
154 -
 155
155 -
 156
156 -
 157
157 -
 158
158 -
 159
159 -
 160
160 -
 161
161 -
 162
162 -
 163
163 -
164
-
165
-
166
-
167
-
168
-
169
-
170
-
171
-
172
-
173
-
174
-
175
-
176
-
177
-
178
-
179
-
180
-
181
-
182
-
183
-
184
-
185
-
186
-
187
-
188
-
189
-
190
-
191
-
192
-
193
-
194
-
195
-
196
-
197
-
198
-
199
-
200
-
201
-
202
-
203
-
204
-
205
-
206
-
207
-
208
-
209
-
210
-
211
-
212
-
213
-
214
-
215
-
216
-
217
-
218
-
219
-
220
-
221
-
222
-
223
-
224
-
225
-
226
-
227
-
228
-
229
-
230
-
231
-
232
-
233
-
234
-
235
-
236
-
237
-
238
-
239
-
240
-
241
-
242
-
243
-
244
-
245
-
246
-
247
-
248
-
249
-
250
-
251
-
252
-
253
-
254
-
255
-
256
-
257
-
258
-
259
-
260
-
261
-
262
-
263
-
264
-
265
-
266
-
267
-
268
-
269
-
270
-
271
-
272
-
273
-
274
-
275
-
276
-
277
-
278
-
279
-
280
-
281
-
282
-
283
-
284
-
285
-
286
-
287
-
288
-
289
-
290
-
291
-
292
-
293
-
294
-
295
-
296
-
297
-
298
-
299
-
300
-
301
-
302
-
303
-
304
-
305
-
306
-
307
-
308
-
309
-
310
-
311
-
312
-
313
-
314
-
315
-
316
-
317
-
318
-
319
-
320
-
321
-
322
-
323
-
324
-
325
-
326
-
327
-
328
-
329
-
330
-
331
-
332
 |
 |

135
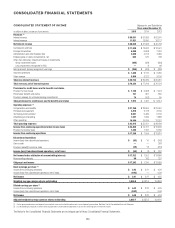
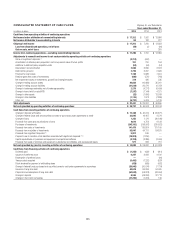
CONSOLIDATED STATEMENT OF CASH FLOWS Citigroup Inc. and Subsidiaries
Years ended December 31,
In millions of dollars 2015 2014 2013
Cash flows from operating activities of continuing operations
Net income before attribution of noncontrolling interests $ 17,332 $ 7,502 $ 13,886
Net income attributable to noncontrolling interests 90 192 227
Citigroup’s net income $ 17,242 $ 7,310 $ 13,659
Loss from discontinued operations, net of taxes (54) (2) (90)
Gain on sale, net of taxes — — 360
Income from continuing operations—excluding noncontrolling interests $ 17,296 $ 7,312 $ 13,389
Adjustments to reconcile net income to net cash provided by operating activities of continuing operations
Gains on significant disposals (1) (3,210) (452) —
Amortization of deferred policy acquisition costs and present value of future profits 191 210 194
Additions to deferred policy acquisition costs (62) (64) (54)
Depreciation and amortization 3,506 3,589 3,303
Deferred tax provision 2,794 3,347 2,699
Provision for loan losses 7,108 6,828 7,604
Realized gains from sales of investments (682) (570) (748)
Net impairment losses on investments, goodwill and intangible assets 318 426 535
Change in trading account assets 46,830 (10,858) 35,001
Change in trading account liabilities (21,524) 30,274 (6,787)
Change in brokerage receivables net of brokerage payables 2,278 (4,272) (6,490)
Change in loans held-for-sale (HFS) (7,207) (1,144) 4,321
Change in other assets (32) (1,690) 13,028
Change in other liabilities (1,135) 7,973 (7,880)
Other, net (6,732) 5,434 5,129
Total adjustments $ 22,441 $ 39,031 $ 49,855
Net cash provided by operating activities of continuing operations $ 39,737 $ 46,343 $ 63,244
Cash flows from investing activities of continuing operations
Change in deposits with banks $ 15,488 $ 40,916 $ (66,871)
Change in federal funds sold and securities borrowed or purchased under agreements to resell 22,895 14,467 4,274
Change in loans 1,353 1,170 (30,198)
Proceeds from sales and securitizations of loans 9,610 4,752 9,123
Purchases of investments (242,362) (258,992) (220,823)
Proceeds from sales of investments 141,470 135,824 131,100
Proceeds from maturities of investments 82,047 94,117 84,831
Proceeds from significant disposals (1) 5,932 346 —
Payments due to transfers of net liabilities associated with significant disposals (1)(2) (18,929) (1,255) —
Capital expenditures on premises and equipment and capitalized software (3,198) (3,386) (3,490)
Proceeds from sales of premises and equipment, subsidiaries and affiliates, and repossessed assets 577 623 716
Net cash provided by (used in) investing activities of continuing operations $ 14,883 $ 28,582 $ (91,338)
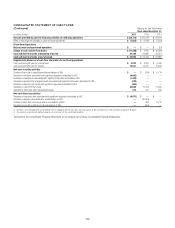
Cash flows from financing activities of continuing operations
Dividends paid $ (1,253) $ (633) $ (314)
Issuance of preferred stock 6,227 3,699 4,192
Redemption of preferred stock —— (94)
Treasury stock acquired (5,452) (1,232) (837)
Stock tendered for payment of withholding taxes (428) (508) (452)
Change in federal funds purchased and securities loaned or sold under agreements to repurchase (26,942) (30,074) (7,724)
Issuance of long-term debt 44,619 66,836 54,405
Payments and redemptions of long-term debt (52,843) (58,923) (63,994)
Change in deposits 8,555 (48,336) 37,713
Change in short-term borrowings (37,256) (1,099) 199