Citibank 2015 Annual Report Download - page 293
Download and view the complete annual report
Please find page 293 of the 2015 Citibank annual report below. You can navigate through the pages in the report by either clicking on the pages listed below, or by using the keyword search tool below to find specific information within the annual report.-
 1
1 -
2
-
3
-
4
-
5
-
6
-
7
-
8
-
9
-
10
-
11
-
12
-
13
-
14
-
15
-
16
-
17
-
18
-
19
-
20
-
21
-
22
-
23
-
24
-
25
-
26
-
27
-
28
-
29
-
30
-
31
-
32
-
33
-
34
-
35
-
36
-
37
-
38
-
39
-
40
-
41
-
42
-
43
-
44
-
45
-
46
-
47
-
48
-
49
-
50
-
51
-
52
-
53
-
54
-
55
-
56
-
57
-
58
-
59
-
60
-
61
-
62
-
63
-
64
-
65
-
66
-
67
-
68
-
69
-
70
-
71
-
72
-
73
-
74
-
75
-
76
-
77
-
78
-
79
-
80
-
81
-
82
-
83
-
84
-
85
-
86
-
87
-
88
-
89
-
90
-
91
-
92
-
93
-
94
-
95
-
96
-
97
-
98
-
99
-
100
-
101
-
102
-
103
-
104
-
105
-
106
-
107
-
108
-
109
-
110
-
111
-
112
-
113
-
114
-
115
-
116
-
117
-
118
-
119
-
120
-
121
-
122
-
123
-
124
-
125
-
126
-
127
-
128
-
129
-
130
-
131
-
132
-
133
-
134
-
135
-
136
-
137
-
138
-
139
-
140
-
141
-
142
-
143
-
144
-
145
-
146
-
147
-
148
-
149
-
150
-
151
-
152
-
153
-
154
-
155
-
156
-
157
-
158
-
159
-
160
-
161
-
162
-
163
-
164
-
165
-
166
-
167
-
168
-
169
-
170
-
171
-
172
-
173
-
174
-
175
-
176
-
177
-
178
-
179
-
180
-
181
-
182
-
183
-
184
-
185
-
186
-
187
-
188
-
189
-
190
-
191
-
192
-
193
-
194
-
195
-
196
-
197
-
198
-
199
-
200
-
201
-
202
-
203
-
204
-
205
-
206
-
207
-
208
-
209
-
210
-
211
-
212
-
213
-
214
-
215
-
216
-
217
-
218
-
219
-
220
-
221
-
222
-
223
-
224
-
225
-
226
-
227
-
228
-
229
-
230
-
231
-
232
-
233
-
234
-
235
-
236
-
237
-
238
-
239
-
240
-
241
-
242
-
243
-
244
-
245
-
246
-
247
-
248
-
249
-
250
-
251
-
252
-
253
-
254
-
255
-
256
-
257
-
258
-
259
-
260
-
261
-
262
-
263
-
264
-
265
-
266
-
267
-
268
-
269
-
270
-
271
-
272
-
273
-
274
-
275
-
276
-
277
-
278
-
279
-
280
-
281
-
282
-
 283
283 -
 284
284 -
 285
285 -
 286
286 -
 287
287 -
 288
288 -
 289
289 -
 290
290 -
 291
291 -
 292
292 -
 293
293 -
 294
294 -
 295
295 -
 296
296 -
 297
297 -
 298
298 -
 299
299 -
 300
300 -
 301
301 -
 302
302 -
 303
303 -
304
-
305
-
306
-
307
-
308
-
309
-
310
-
311
-
312
-
313
-
314
-
315
-
316
-
317
-
318
-
319
-
320
-
321
-
322
-
323
-
324
-
325
-
326
-
327
-
328
-
329
-
330
-
331
-
332
 |
 |

275
Certain Structured Liabilities
The Company has elected the fair value option for certain structured
liabilities whose performance is linked to structured interest rates, inflation,
currency, equity, referenced credit or commodity risks. The Company
elected the fair value option, because these exposures are considered to be
trading-related positions and, therefore, are managed on a fair value basis.
These positions will continue to be classified as debt, deposits or derivatives
(Trading account liabilities) on the Company’s Consolidated Balance Sheet
according to their legal form.
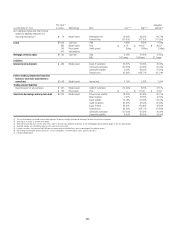
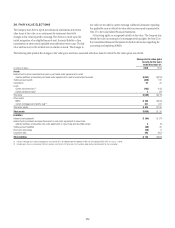
The following table provides information about the carrying value of structured notes, disaggregated by type of embedded derivative instrument:
In billions of dollars December 31, 2015 December 31, 2014
Interest rate linked $ 9.6 $10.9
Foreign exchange linked 0.3 0.3
Equity linked 9.9 8.0
Commodity linked 1.4 1.4
Credit linked 1.6 2.5
Total $22.8 $23.1
The change in the fair value of these structured liabilities is reported in
Principal transactions in the Company’s Consolidated Statement of Income.
Changes in the fair value of these structured liabilities include an economic
component for accrued interest, which is included in the change in fair value
reported in Principal transactions.
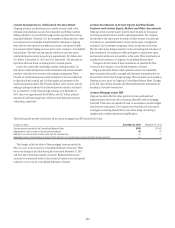
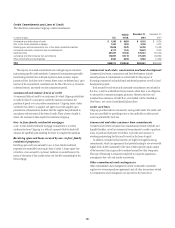
Certain Non-Structured Liabilities
The Company has elected the fair value option for certain non-structured
liabilities with fixed and floating interest rates. The Company has elected
the fair value option where the interest-rate risk of such liabilities is
economically hedged with derivative contracts or the proceeds are used
to purchase financial assets that will also be accounted for at fair value
through earnings. The election has been made to mitigate accounting
mismatches and to achieve operational simplifications. These positions are
reported in Short-term borrowings and Long-term debt on the Company’s
Consolidated Balance Sheet. The change in the fair value of these non-
structured liabilities is reported in Principal transactions in the Company’s
Consolidated Statement of Income. Related interest expense on non-
structured liabilities is measured based on the contractual interest rates and
reported as Interest expense in the Consolidated Statement of Income.
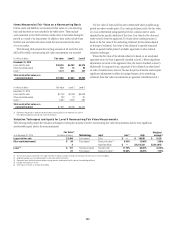
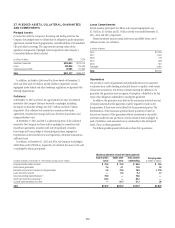
The following table provides information about long-term debt carried at fair value:
In millions of dollars December 31, 2015 December 31, 2014
Carrying amount reported on the Consolidated Balance Sheet $25,293 $26,180
Aggregate unpaid principal balance in excess of (less than) fair value 1,569 (151)
The following table provides information about short-term borrowings carried at fair value:
In millions of dollars December 31, 2015 December 31, 2014
Carrying amount reported on the Consolidated Balance Sheet $1,207 $1,496
Aggregate unpaid principal balance in excess of (less than) fair value 130 31