Citibank 2015 Annual Report Download - page 3
Download and view the complete annual report
Please find page 3 of the 2015 Citibank annual report below. You can navigate through the pages in the report by either clicking on the pages listed below, or by using the keyword search tool below to find specific information within the annual report.-
 1
1 -
 2
2 -
 3
3 -
 4
4 -
 5
5 -
 6
6 -
 7
7 -
 8
8 -
 9
9 -
 10
10 -
 11
11 -
 12
12 -
 13
13 -
 14
14 -
15
-
16
-
17
-
18
-
19
-
20
-
21
-
22
-
23
-
24
-
25
-
26
-
27
-
28
-
29
-
30
-
31
-
32
-
33
-
34
-
35
-
36
-
37
-
38
-
39
-
40
-
41
-
42
-
43
-
44
-
45
-
46
-
47
-
48
-
49
-
50
-
51
-
52
-
53
-
54
-
55
-
56
-
57
-
58
-
59
-
60
-
61
-
62
-
63
-
64
-
65
-
66
-
67
-
68
-
69
-
70
-
71
-
72
-
73
-
74
-
75
-
76
-
77
-
78
-
79
-
80
-
81
-
82
-
83
-
84
-
85
-
86
-
87
-
88
-
89
-
90
-
91
-
92
-
93
-
94
-
95
-
96
-
97
-
98
-
99
-
100
-
101
-
102
-
103
-
104
-
105
-
106
-
107
-
108
-
109
-
110
-
111
-
112
-
113
-
114
-
115
-
116
-
117
-
118
-
119
-
120
-
121
-
122
-
123
-
124
-
125
-
126
-
127
-
128
-
129
-
130
-
131
-
132
-
133
-
134
-
135
-
136
-
137
-
138
-
139
-
140
-
141
-
142
-
143
-
144
-
145
-
146
-
147
-
148
-
149
-
150
-
151
-
152
-
153
-
154
-
155
-
156
-
157
-
158
-
159
-
160
-
161
-
162
-
163
-
164
-
165
-
166
-
167
-
168
-
169
-
170
-
171
-
172
-
173
-
174
-
175
-
176
-
177
-
178
-
179
-
180
-
181
-
182
-
183
-
184
-
185
-
186
-
187
-
188
-
189
-
190
-
191
-
192
-
193
-
194
-
195
-
196
-
197
-
198
-
199
-
200
-
201
-
202
-
203
-
204
-
205
-
206
-
207
-
208
-
209
-
210
-
211
-
212
-
213
-
214
-
215
-
216
-
217
-
218
-
219
-
220
-
221
-
222
-
223
-
224
-
225
-
226
-
227
-
228
-
229
-
230
-
231
-
232
-
233
-
234
-
235
-
236
-
237
-
238
-
239
-
240
-
241
-
242
-
243
-
244
-
245
-
246
-
247
-
248
-
249
-
250
-
251
-
252
-
253
-
254
-
255
-
256
-
257
-
258
-
259
-
260
-
261
-
262
-
263
-
264
-
265
-
266
-
267
-
268
-
269
-
270
-
271
-
272
-
273
-
274
-
275
-
276
-
277
-
278
-
279
-
280
-
281
-
282
-
283
-
284
-
285
-
286
-
287
-
288
-
289
-
290
-
291
-
292
-
293
-
294
-
295
-
296
-
297
-
298
-
299
-
300
-
301
-
302
-
303
-
304
-
305
-
306
-
307
-
308
-
309
-
310
-
311
-
312
-
313
-
314
-
315
-
316
-
317
-
318
-
319
-
320
-
321
-
322
-
323
-
324
-
325
-
326
-
327
-
328
-
329
-
330
-
331
-
332
 |
 |

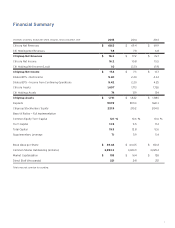
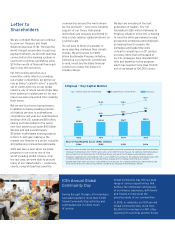
Financial Summary
In billions of dollars, except per-share amounts, ratios and direct staff 2015 2014 2013
Citicorp Net Revenues $ 68.5 $69.4 $69.9
Citi Holdings Net Revenues 7. 8 7. 8 6.8
Citigroup Net Revenues $ 76.3 $7 7. 2 $76.7
Citicorp Net Income 16.2 10.8 15.5
Citi Holdings Net Income (Loss) 1.0 (3.5) (1.9)
Citigroup Net Income $ 17.2 $7. 3 $13.7
Diluted EPS — Net Income 5.40 2.20 4.34
Diluted EPS — Income from Continuing Operations 5.42 2.20 4.25
Citicorp Assets 1,657 1,713 1,726
Citi Holdings Assets 74 129 154
Citigroup Assets $ 1,731 $ 1,842 $ 1,880
Deposits 9 07.9 899.3 968.3
Citigroup Stockholders’ Equity 221.9 210.2 204.0
Basel III Ratios — Full Implementation
Common Equity Tier 1 Capital 12.1 % 10.6 % 10.6 %
Tier 1 Capital 13.5 11.5 11.2
Total Capital 15.3 12.8 12.6
Supplementary Leverage 7.1 5.9 5.4
Book Value per Share $69.46 $ 66.05 $ 65.12
Common Shares Outstanding (millions) 2,953.3 3,023.9 3,029.2
Market Capitalization $153 $ 164 $ 158
Direct Staff (thousands) 231 241 251
Totals may not sum due to rounding.
1