Citibank 2015 Annual Report Download - page 183
Download and view the complete annual report
Please find page 183 of the 2015 Citibank annual report below. You can navigate through the pages in the report by either clicking on the pages listed below, or by using the keyword search tool below to find specific information within the annual report.-
 1
1 -
2
-
3
-
4
-
5
-
6
-
7
-
8
-
9
-
10
-
11
-
12
-
13
-
14
-
15
-
16
-
17
-
18
-
19
-
20
-
21
-
22
-
23
-
24
-
25
-
26
-
27
-
28
-
29
-
30
-
31
-
32
-
33
-
34
-
35
-
36
-
37
-
38
-
39
-
40
-
41
-
42
-
43
-
44
-
45
-
46
-
47
-
48
-
49
-
50
-
51
-
52
-
53
-
54
-
55
-
56
-
57
-
58
-
59
-
60
-
61
-
62
-
63
-
64
-
65
-
66
-
67
-
68
-
69
-
70
-
71
-
72
-
73
-
74
-
75
-
76
-
77
-
78
-
79
-
80
-
81
-
82
-
83
-
84
-
85
-
86
-
87
-
88
-
89
-
90
-
91
-
92
-
93
-
94
-
95
-
96
-
97
-
98
-
99
-
100
-
101
-
102
-
103
-
104
-
105
-
106
-
107
-
108
-
109
-
110
-
111
-
112
-
113
-
114
-
115
-
116
-
117
-
118
-
119
-
120
-
121
-
122
-
123
-
124
-
125
-
126
-
127
-
128
-
129
-
130
-
131
-
132
-
133
-
134
-
135
-
136
-
137
-
138
-
139
-
140
-
141
-
142
-
143
-
144
-
145
-
146
-
147
-
148
-
149
-
150
-
151
-
152
-
153
-
154
-
155
-
156
-
157
-
158
-
159
-
160
-
161
-
162
-
163
-
164
-
165
-
166
-
167
-
168
-
169
-
170
-
171
-
172
-
 173
173 -
 174
174 -
 175
175 -
 176
176 -
 177
177 -
 178
178 -
 179
179 -
 180
180 -
 181
181 -
 182
182 -
 183
183 -
 184
184 -
 185
185 -
 186
186 -
 187
187 -
 188
188 -
 189
189 -
 190
190 -
 191
191 -
 192
192 -
 193
193 -
194
-
195
-
196
-
197
-
198
-
199
-
200
-
201
-
202
-
203
-
204
-
205
-
206
-
207
-
208
-
209
-
210
-
211
-
212
-
213
-
214
-
215
-
216
-
217
-
218
-
219
-
220
-
221
-
222
-
223
-
224
-
225
-
226
-
227
-
228
-
229
-
230
-
231
-
232
-
233
-
234
-
235
-
236
-
237
-
238
-
239
-
240
-
241
-
242
-
243
-
244
-
245
-
246
-
247
-
248
-
249
-
250
-
251
-
252
-
253
-
254
-
255
-
256
-
257
-
258
-
259
-
260
-
261
-
262
-
263
-
264
-
265
-
266
-
267
-
268
-
269
-
270
-
271
-
272
-
273
-
274
-
275
-
276
-
277
-
278
-
279
-
280
-
281
-
282
-
283
-
284
-
285
-
286
-
287
-
288
-
289
-
290
-
291
-
292
-
293
-
294
-
295
-
296
-
297
-
298
-
299
-
300
-
301
-
302
-
303
-
304
-
305
-
306
-
307
-
308
-
309
-
310
-
311
-
312
-
313
-
314
-
315
-
316
-
317
-
318
-
319
-
320
-
321
-
322
-
323
-
324
-
325
-
326
-
327
-
328
-
329
-
330
-
331
-
332
 |
 |

165
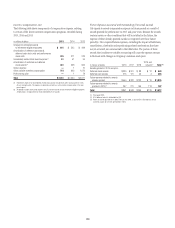
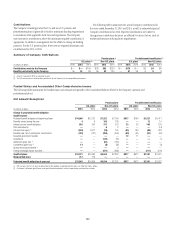
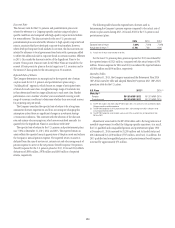
Sensitivities of Certain Key Assumptions
The following tables summarize the effect on pension expense of a one-
percentage-point change in the discount rate:
One-percentage-point increase
In millions of dollars 2015 2014 2013
U.S. plans $ 26 $ 28 $ 16
Non-U.S. plans (32) (39) (52)
One-percentage-point decrease
In millions of dollars 2015 2014 2013
U.S. plans $(44) $(45) $(57)
Non-U.S. plans 44 56 79
Since the U.S. qualified pension plan was frozen, the majority of the
prospective service cost has been eliminated and the gain/loss amortization
period was changed to the life expectancy for inactive participants. As a
result, pension expense for the U.S. qualified pension plan is driven more
by interest costs than service costs, and an increase in the discount rate
would increase pension expense, while a decrease in the discount rate would
decrease pension expense.
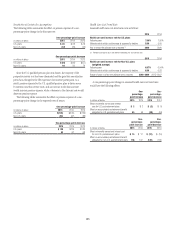
The following tables summarize the effect on pension expense of a one-
percentage-point change in the expected rates of return:
One-percentage-point increase
In millions of dollars 2015 2014 2013
U.S. plans $(128) $(129) $(123)
Non-U.S. plans (63) (67) (68)
One-percentage-point decrease
In millions of dollars 2015 2014 2013
U.S. plans $ 128 $129 $123
Non-U.S. plans 63 67 68
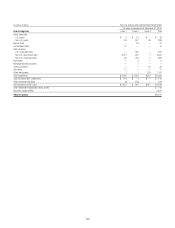
Health Care Cost Trend Rate
Assumed health care cost-trend rates were as follows:
2015 2014
Health care cost increase rate for U.S. plans
Following year 7.00% 7.50%
Ultimate rate to which cost increase is assumed to decline 5.00 5.00
Year in which the ultimate rate is reached (1) 2020 2020
(1) Weighted average for plans with different following year and ultimate rates.
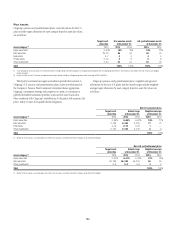
2015 2014
Health care cost increase rate for Non-U.S. plans
(weighted average)
Following year 6.87% 6.94%
Ultimate rate to which cost increase is assumed to decline 6.86 6.93
Range of years in which the ultimate rate is reached 2016–2029 2015–2027
A one-percentage-point change in assumed health care cost trend rates
would have the following effects:
One-
percentage-
point increase
One-
percentage-
point decrease
In millions of dollars 2015 2014 2015 2014
Effect on benefits earned and interest
cost for U.S. postretirement plans $ 2 $ 2 $ (2) $ (1)
Effect on accumulated postretirement benefit
obligation for U.S. postretirement plans 45 40 (38) (34)
One-
percentage-
point increase
One-
percentage-
point decrease
In millions of dollars 2015 2014 2015 2014
Effect on benefits earned and interest cost
for non-U.S. postretirement plans $ 15 $ 17 $ (12) $ (14)
Effect on accumulated postretirement benefit
obligation for non-U.S. postretirement plans 156 197 (128) (161)