Citibank 2015 Annual Report Download - page 118
Download and view the complete annual report
Please find page 118 of the 2015 Citibank annual report below. You can navigate through the pages in the report by either clicking on the pages listed below, or by using the keyword search tool below to find specific information within the annual report.-
 1
1 -
2
-
3
-
4
-
5
-
6
-
7
-
8
-
9
-
10
-
11
-
12
-
13
-
14
-
15
-
16
-
17
-
18
-
19
-
20
-
21
-
22
-
23
-
24
-
25
-
26
-
27
-
28
-
29
-
30
-
31
-
32
-
33
-
34
-
35
-
36
-
37
-
38
-
39
-
40
-
41
-
42
-
43
-
44
-
45
-
46
-
47
-
48
-
49
-
50
-
51
-
52
-
53
-
54
-
55
-
56
-
57
-
58
-
59
-
60
-
61
-
62
-
63
-
64
-
65
-
66
-
67
-
68
-
69
-
70
-
71
-
72
-
73
-
74
-
75
-
76
-
77
-
78
-
79
-
80
-
81
-
82
-
83
-
84
-
85
-
86
-
87
-
88
-
89
-
90
-
91
-
92
-
93
-
94
-
95
-
96
-
97
-
98
-
99
-
100
-
101
-
102
-
103
-
104
-
105
-
106
-
107
-
 108
108 -
 109
109 -
 110
110 -
 111
111 -
 112
112 -
 113
113 -
 114
114 -
 115
115 -
 116
116 -
 117
117 -
 118
118 -
 119
119 -
 120
120 -
 121
121 -
 122
122 -
 123
123 -
 124
124 -
 125
125 -
 126
126 -
 127
127 -
 128
128 -
129
-
130
-
131
-
132
-
133
-
134
-
135
-
136
-
137
-
138
-
139
-
140
-
141
-
142
-
143
-
144
-
145
-
146
-
147
-
148
-
149
-
150
-
151
-
152
-
153
-
154
-
155
-
156
-
157
-
158
-
159
-
160
-
161
-
162
-
163
-
164
-
165
-
166
-
167
-
168
-
169
-
170
-
171
-
172
-
173
-
174
-
175
-
176
-
177
-
178
-
179
-
180
-
181
-
182
-
183
-
184
-
185
-
186
-
187
-
188
-
189
-
190
-
191
-
192
-
193
-
194
-
195
-
196
-
197
-
198
-
199
-
200
-
201
-
202
-
203
-
204
-
205
-
206
-
207
-
208
-
209
-
210
-
211
-
212
-
213
-
214
-
215
-
216
-
217
-
218
-
219
-
220
-
221
-
222
-
223
-
224
-
225
-
226
-
227
-
228
-
229
-
230
-
231
-
232
-
233
-
234
-
235
-
236
-
237
-
238
-
239
-
240
-
241
-
242
-
243
-
244
-
245
-
246
-
247
-
248
-
249
-
250
-
251
-
252
-
253
-
254
-
255
-
256
-
257
-
258
-
259
-
260
-
261
-
262
-
263
-
264
-
265
-
266
-
267
-
268
-
269
-
270
-
271
-
272
-
273
-
274
-
275
-
276
-
277
-
278
-
279
-
280
-
281
-
282
-
283
-
284
-
285
-
286
-
287
-
288
-
289
-
290
-
291
-
292
-
293
-
294
-
295
-
296
-
297
-
298
-
299
-
300
-
301
-
302
-
303
-
304
-
305
-
306
-
307
-
308
-
309
-
310
-
311
-
312
-
313
-
314
-
315
-
316
-
317
-
318
-
319
-
320
-
321
-
322
-
323
-
324
-
325
-
326
-
327
-
328
-
329
-
330
-
331
-
332
 |
 |
100
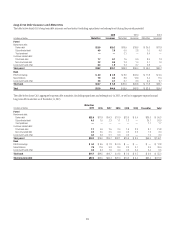
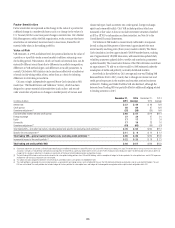
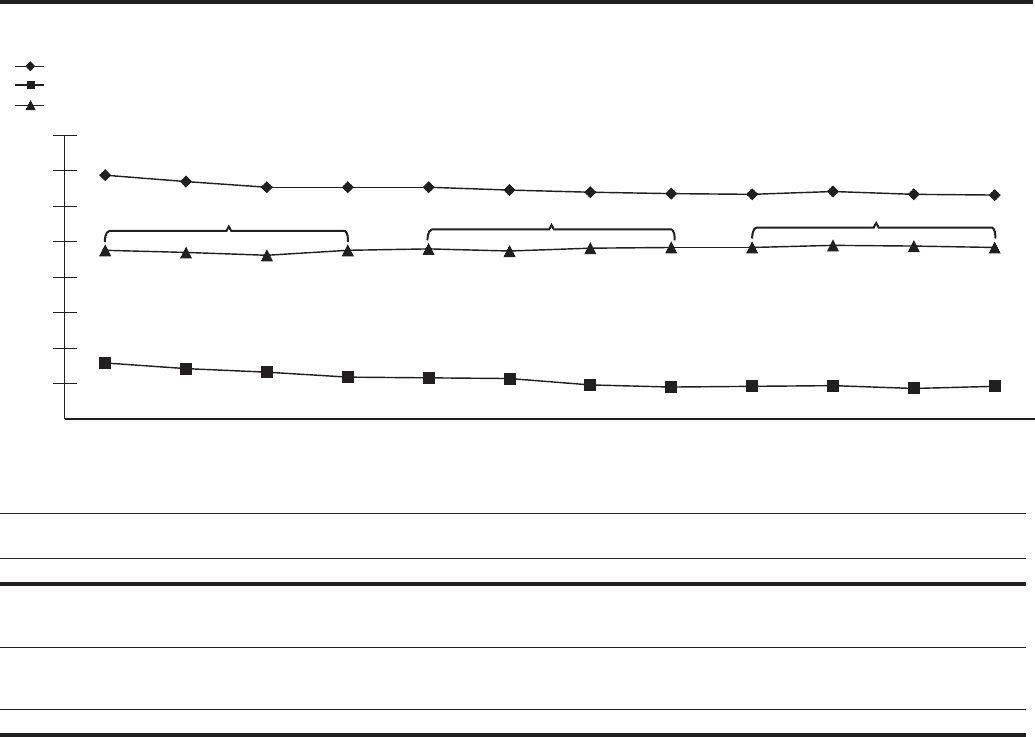
Interest Revenue/Expense and Net Interest Margin
Average Rates
-
Interest Revenue, Interest Expense, and Net Interest Margin
Interest Revenue-Average Rate
Interest Expense-Average Rate
Net Interest Margin
0.96%
0.93%
0.97%
0.96%
0.95%
0.98%
1.07%
1.08%
1.09%
1.16%
1.21%
1.29%
2.88%
3.94% 3.85% 3.77% 3.77% 3.77% 3.73% 3.70% 3.68% 3.67% 3.71% 3.67% 3.66%
2.85% 2.81% 2.88% 2.90% 2.87% 2.91% 2.92% 2.92% 2.95% 2.94% 2.92%
1Q13 2Q13
2013: 2.85% 2014: 2.90% 2015: 2.93%
3Q13 4Q13 1Q14 2Q14 3Q14 4Q14 1Q15 2Q15 3Q15 4Q15
0.50%
1.00%
1.50%
2.00%
2.50%
3.00%
3.50%
4.00%
4.50%
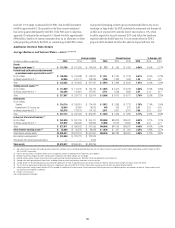
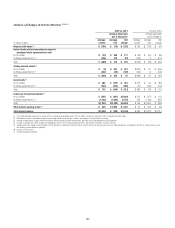
In millions of dollars, except as otherwise noted 2015 2014 2013
Change
2015 vs. 2014
Change
2014 vs. 2013
Interest revenue (1) $59,040 $62,180 $63,491 (5)% (2)%
Interest expense 11,921 13,690 16,177 (13) (15)
Net interest revenue (1)(2) $47,119 $48,490 $47,314 (3)% 2%
Interest revenue—average rate 3.68% 3.72% 3.83% (4)bps (11)bps
Interest expense—average rate 0.95 1.02 1.19 (7)bps (17)bps
Net interest margin 2.93 2.90 2.85 3 bps 5bps
Interest-rate benchmarks
Two-year U.S. Treasury note—average rate 0.69% 0.46% 0.31% 23 bps 15bps
10-year U.S. Treasury note—average rate 2.14 2.54 2.35 (40)bps 19bps
10-year vs. two-year spread 145bps 208bps 204bps
Note: All interest expense amounts include FDIC deposit insurance assessments.
(1) Net interest revenue includes the taxable equivalent adjustments related to the tax-exempt bond portfolio (based on the U.S. federal statutory tax rate of 35%) of $487 million, $498 million, and $521 million for 2015,
2014 and 2013, respectively.
(2) Excludes expenses associated with certain hybrid financial instruments, which are classified as Long-term debt and accounted for at fair value with changes recorded in Principal transactions.
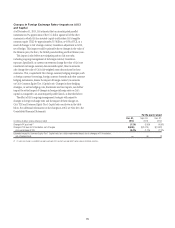
Citi’s net interest margin (NIM) is calculated by dividing gross interest
revenue less gross interest expense by average interest earning assets. Citi’s
NIM was 2.92% in the fourth quarter of 2015, a slight decrease from 2.94%
in the third quarter of 2015, and improved to 2.93% for the full year 2015,
compared to 2.90% in 2014. The improvement in Citi’s NIM for the full
year 2015 was driven by trading NIM and the impact of lower cost of funds,
primarily declines in the cost of long-term debt, partially offset by lower loan
yields. Going into 2016, Citi’s NIM will reflect the sale of OneMain Financial,
which will be partially offset by the benefit of debt repurchases during 2015,
including in the fourth quarter of 2015. Accordingly, Citi currently expects a
decrease in its NIM in the first half of 2016.
As noted in the tables above, Citi’s interest expense includes the impact
of FDIC deposit insurance assessments. As part of the Dodd-Frank Act, the
FDIC is required to ensure that its deposit insurance fund reserve ratio
reaches 1.35% by September 30, 2020. In the fourth quarter of 2015, the
FDIC issued a notice of proposed rulemaking that would impose on insured
depository institutions with at least $10 billion in assets (large banks),
which includes Citibank, a surcharge of 4.5 basis points per annum until
the fund reaches the required ratio, which the FDIC estimates would take
approximately two years. Based on its current assessment base, Citi estimates
the net impact to Citibank would be approximately $500 million over the
two-year period. As part of its proposed rulemaking, the FDIC also discussed
an alternative to the surcharge proposal which would impose a one-time
assessment, similar to a shortfall assessment, on large banks in order to