Citibank 2015 Annual Report Download - page 315
Download and view the complete annual report
Please find page 315 of the 2015 Citibank annual report below. You can navigate through the pages in the report by either clicking on the pages listed below, or by using the keyword search tool below to find specific information within the annual report.-
 1
1 -
2
-
3
-
4
-
5
-
6
-
7
-
8
-
9
-
10
-
11
-
12
-
13
-
14
-
15
-
16
-
17
-
18
-
19
-
20
-
21
-
22
-
23
-
24
-
25
-
26
-
27
-
28
-
29
-
30
-
31
-
32
-
33
-
34
-
35
-
36
-
37
-
38
-
39
-
40
-
41
-
42
-
43
-
44
-
45
-
46
-
47
-
48
-
49
-
50
-
51
-
52
-
53
-
54
-
55
-
56
-
57
-
58
-
59
-
60
-
61
-
62
-
63
-
64
-
65
-
66
-
67
-
68
-
69
-
70
-
71
-
72
-
73
-
74
-
75
-
76
-
77
-
78
-
79
-
80
-
81
-
82
-
83
-
84
-
85
-
86
-
87
-
88
-
89
-
90
-
91
-
92
-
93
-
94
-
95
-
96
-
97
-
98
-
99
-
100
-
101
-
102
-
103
-
104
-
105
-
106
-
107
-
108
-
109
-
110
-
111
-
112
-
113
-
114
-
115
-
116
-
117
-
118
-
119
-
120
-
121
-
122
-
123
-
124
-
125
-
126
-
127
-
128
-
129
-
130
-
131
-
132
-
133
-
134
-
135
-
136
-
137
-
138
-
139
-
140
-
141
-
142
-
143
-
144
-
145
-
146
-
147
-
148
-
149
-
150
-
151
-
152
-
153
-
154
-
155
-
156
-
157
-
158
-
159
-
160
-
161
-
162
-
163
-
164
-
165
-
166
-
167
-
168
-
169
-
170
-
171
-
172
-
173
-
174
-
175
-
176
-
177
-
178
-
179
-
180
-
181
-
182
-
183
-
184
-
185
-
186
-
187
-
188
-
189
-
190
-
191
-
192
-
193
-
194
-
195
-
196
-
197
-
198
-
199
-
200
-
201
-
202
-
203
-
204
-
205
-
206
-
207
-
208
-
209
-
210
-
211
-
212
-
213
-
214
-
215
-
216
-
217
-
218
-
219
-
220
-
221
-
222
-
223
-
224
-
225
-
226
-
227
-
228
-
229
-
230
-
231
-
232
-
233
-
234
-
235
-
236
-
237
-
238
-
239
-
240
-
241
-
242
-
243
-
244
-
245
-
246
-
247
-
248
-
249
-
250
-
251
-
252
-
253
-
254
-
255
-
256
-
257
-
258
-
259
-
260
-
261
-
262
-
263
-
264
-
265
-
266
-
267
-
268
-
269
-
270
-
271
-
272
-
273
-
274
-
275
-
276
-
277
-
278
-
279
-
280
-
281
-
282
-
283
-
284
-
285
-
286
-
287
-
288
-
289
-
290
-
291
-
292
-
293
-
294
-
295
-
296
-
297
-
298
-
299
-
300
-
301
-
302
-
303
-
304
-
 305
305 -
 306
306 -
 307
307 -
 308
308 -
 309
309 -
 310
310 -
 311
311 -
 312
312 -
 313
313 -
 314
314 -
 315
315 -
 316
316 -
 317
317 -
 318
318 -
 319
319 -
 320
320 -
 321
321 -
 322
322 -
 323
323 -
 324
324 -
 325
325 -
326
-
327
-
328
-
329
-
330
-
331
-
332
 |
 |

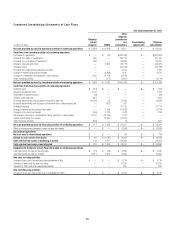
297
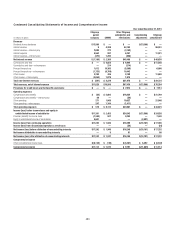
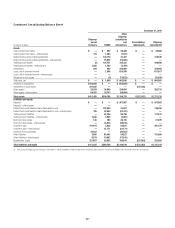
Condensed Consolidating Balance Sheet
December 31, 2015
In millions of dollars
Citigroup
parent
company CGMHI
Other
Citigroup
subsidiaries
and
eliminations
Consolidating
adjustments
Citigroup
consolidated
Assets
Cash and due from banks $ — $ 592 $ 20,308 $ — $ 20,900
Cash and due from banks—intercompany 124 1,403 (1,527) — —
Federal funds sold and resale agreements — 178,178 41,497 — 219,675
Federal funds sold and resale agreements—intercompany — 15,035 (15,035) — —
Trading account assets (8) 124,731 125,233 — 249,956
Trading account assets—intercompany 1,032 1,765 (2,797) — —
Investments 484 402 342,069 — 342,955
Loans, net of unearned income — 1,068 616,549 — 617,617
Loans, net of unearned income—intercompany — — — — —
Allowance for loan losses — (3) (12,623) — (12,626)
Total loans, net $ — $ 1,065 $ 603,926 $ — $ 604,991
Advances to subsidiaries $104,405 $ — $ (104,405) $ — $ —
Investments in subsidiaries 221,362 — — (221,362) —
Other assets (1) 25,819 36,860 230,054 — 292,733
Other assets—intercompany 58,207 30,737 (88,944) — —
Total assets $411,425 $390,768 $1,150,379 $(221,362) $1,731,210
Liabilities and equity
Deposits $ — $ — $ 907,887 $ — $ 907,887
Deposits—intercompany — — — — —
Federal funds purchased and securities loaned or sold — 122,459 24,037 — 146,496
Federal funds purchased and securities loaned or sold—intercompany 185 22,042 (22,227) — —
Trading account liabilities — 62,386 55,126 — 117,512
Trading account liabilities—intercompany 1,036 2,045 (3,081) — —
Short-term borrowings 146 188 20,745 — 21,079
Short-term borrowings—intercompany — 34,916 (34,916) — —
Long-term debt 141,914 2,530 56,831 — 201,275
Long-term debt—intercompany — 51,171 (51,171) — —
Advances from subsidiaries 36,453 — (36,453) — —
Other liabilities 3,560 55,482 54,827 — 113,869
Other liabilities—intercompany 6,274 10,967 (17,241) — —
Stockholders’ equity 221,857 26,582 196,015 (221,362) 223,092
Total liabilities and equity $411,425 $390,768 $1,150,379 $(221,362) $1,731,210
(1) Other assets for Citigroup parent company at December 31, 2015 included $21.8 billion of placements to Citibank and its branches, of which $13.9 billion had a remaining term of less than 30 days.