Citibank 2015 Annual Report Download - page 196
Download and view the complete annual report
Please find page 196 of the 2015 Citibank annual report below. You can navigate through the pages in the report by either clicking on the pages listed below, or by using the keyword search tool below to find specific information within the annual report.-
 1
1 -
2
-
3
-
4
-
5
-
6
-
7
-
8
-
9
-
10
-
11
-
12
-
13
-
14
-
15
-
16
-
17
-
18
-
19
-
20
-
21
-
22
-
23
-
24
-
25
-
26
-
27
-
28
-
29
-
30
-
31
-
32
-
33
-
34
-
35
-
36
-
37
-
38
-
39
-
40
-
41
-
42
-
43
-
44
-
45
-
46
-
47
-
48
-
49
-
50
-
51
-
52
-
53
-
54
-
55
-
56
-
57
-
58
-
59
-
60
-
61
-
62
-
63
-
64
-
65
-
66
-
67
-
68
-
69
-
70
-
71
-
72
-
73
-
74
-
75
-
76
-
77
-
78
-
79
-
80
-
81
-
82
-
83
-
84
-
85
-
86
-
87
-
88
-
89
-
90
-
91
-
92
-
93
-
94
-
95
-
96
-
97
-
98
-
99
-
100
-
101
-
102
-
103
-
104
-
105
-
106
-
107
-
108
-
109
-
110
-
111
-
112
-
113
-
114
-
115
-
116
-
117
-
118
-
119
-
120
-
121
-
122
-
123
-
124
-
125
-
126
-
127
-
128
-
129
-
130
-
131
-
132
-
133
-
134
-
135
-
136
-
137
-
138
-
139
-
140
-
141
-
142
-
143
-
144
-
145
-
146
-
147
-
148
-
149
-
150
-
151
-
152
-
153
-
154
-
155
-
156
-
157
-
158
-
159
-
160
-
161
-
162
-
163
-
164
-
165
-
166
-
167
-
168
-
169
-
170
-
171
-
172
-
173
-
174
-
175
-
176
-
177
-
178
-
179
-
180
-
181
-
182
-
183
-
184
-
185
-
 186
186 -
 187
187 -
 188
188 -
 189
189 -
 190
190 -
 191
191 -
 192
192 -
 193
193 -
 194
194 -
 195
195 -
 196
196 -
 197
197 -
 198
198 -
 199
199 -
 200
200 -
 201
201 -
 202
202 -
 203
203 -
 204
204 -
 205
205 -
 206
206 -
207
-
208
-
209
-
210
-
211
-
212
-
213
-
214
-
215
-
216
-
217
-
218
-
219
-
220
-
221
-
222
-
223
-
224
-
225
-
226
-
227
-
228
-
229
-
230
-
231
-
232
-
233
-
234
-
235
-
236
-
237
-
238
-
239
-
240
-
241
-
242
-
243
-
244
-
245
-
246
-
247
-
248
-
249
-
250
-
251
-
252
-
253
-
254
-
255
-
256
-
257
-
258
-
259
-
260
-
261
-
262
-
263
-
264
-
265
-
266
-
267
-
268
-
269
-
270
-
271
-
272
-
273
-
274
-
275
-
276
-
277
-
278
-
279
-
280
-
281
-
282
-
283
-
284
-
285
-
286
-
287
-
288
-
289
-
290
-
291
-
292
-
293
-
294
-
295
-
296
-
297
-
298
-
299
-
300
-
301
-
302
-
303
-
304
-
305
-
306
-
307
-
308
-
309
-
310
-
311
-
312
-
313
-
314
-
315
-
316
-
317
-
318
-
319
-
320
-
321
-
322
-
323
-
324
-
325
-
326
-
327
-
328
-
329
-
330
-
331
-
332
 |
 |

178
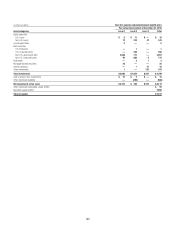
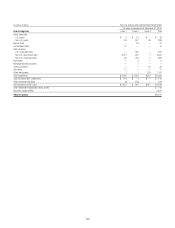
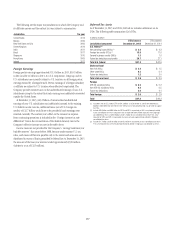
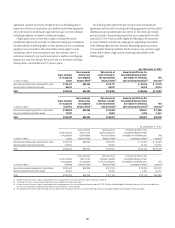
The following table summarizes the amounts of tax carry-forwards and
their expiration dates:
In billions of dollars
Year of expiration
December 31,
2015
December 31,
2014
U.S. tax return foreign tax credit
carry-forwards
2017 $ — $ 1.9
2018 4.8 5.2
2019 1.2 1.2
2020 3.1 3.1
2021 1.7 1.8
2022 3.4 3.4
2023 (1) 0.4 1.0
2025 (1) 1.3 —
Total U.S. tax return foreign tax credit
carry-forwards $15.9 $17.6
U.S. tax return general business credit
carry-forwards
2030 $ — $ 0.4
2031 0.2 0.3
2032 0.4 0.4
2033 0.3 0.3
2034 0.2 0.2
2035 0.2 —
Total U.S. tax return general business credit
carry-forwards $ 1.3 $ 1.6
U.S. subsidiary separate federal NOL
carry-forwards
2027 $ 0.2 $ 0.2
2028 0.1 0.1
2030 0.3 0.3
2031 1.5 1.7
2033 1.7 1.9
2034 2.3 2.3
2035 3.6 —
Total U.S. subsidiary separate federal NOL
carry-forwards (2) $ 9.7 $ 6.5
New York State NOL carry-forwards
2034 $14.6 $12.3
Total New York State NOL carry-forwards (2) $14.6 $12.3
New York City NOL carry-forwards
2028 $ — $ 3.8
2031 —0.1
2032 —0.5
2034 13.3 —
Total New York City NOL carry-forwards (2) $13.3 $ 4.4
APB 23 subsidiary NOL carry-forwards
Various $ 0.2 $ 0.2
Total APB 23 subsidiary NOL carry-forwards $ 0.2 $ 0.2
(1) The $1.7 billion in FTC carry-forwards that expire in 2023 and 2025 are in a non-consolidated tax
return entity but are eventually expected to be utilized in Citigroup’s consolidated tax return.
(2) Pretax.
While Citi’s net total DTAs decreased year-over-year, the time remaining
for utilization has shortened, given the passage of time, particularly with
respect to the foreign tax credit (FTC) component of the DTAs. Although
realization is not assured, Citi believes that the realization of the recognized
net DTAs of $47.8 billion at December 31, 2015 is more-likely-than-not based
upon expectations as to future taxable income in the jurisdictions in which
the DTAs arise and available tax planning strategies (as defined in ASC 740,
Income Taxes) that would be implemented, if necessary, to prevent a carry-
forward from expiring.
Citi has concluded that it has the necessary positive evidence to support
the full realization of its DTAs. Specifically, Citi forecasts sufficient U.S.
taxable income in the carry-forward periods, exclusive of ASC 740 tax
planning strategies. Citi’s forecasted taxable income, which will continue to
be subject to overall market and global economic conditions, incorporates
geographic business forecasts and taxable income adjustments to those
forecasts (e.g., U.S. tax-exempt income, loan loss reserves deductible for U.S.
tax reporting in subsequent years), and actions intended to optimize its U.S.
taxable earnings. In general, Citi would need to generate approximately
$59 billion of U.S. taxable income during the FTC carry-forward periods to
prevent this most time-sensitive component of Citi’s FTCs from expiring.
In addition to its forecasted U.S. taxable income, Citi has tax planning
strategies available to it under ASC 740 that would be implemented, if
necessary, to prevent a carry-forward from expiring. These strategies include:
(i) repatriating low-taxed foreign source earnings for which an assertion
that the earnings have been indefinitely reinvested has not been made;
(ii) accelerating U.S. taxable income into, or deferring U.S. tax deductions out
of, the latter years of the carry-forward period (e.g., selling appreciated assets,
electing straight-line depreciation); (iii) accelerating deductible temporary
differences outside the U.S.; and (iv) selling certain assets that produce tax-
exempt income, while purchasing assets that produce fully taxable income. In
addition, the sale or restructuring of certain businesses can produce significant
U.S. taxable income within the relevant carry-forward periods.
Based upon the foregoing discussion, Citi believes the U.S. federal and
New York state and city NOL carry-forward period of 20 years provides
enough time to fully utilize the DTAs pertaining to the existing NOL carry-
forwards and any NOL that would be created by the reversal of the future net
deductions that have not yet been taken on a tax return.
With respect to the FTCs component of the DTAs, the carry-forward period
is 10 years. Utilization of FTCs in any year is restricted to 35% of foreign
source taxable income in that year. However, overall domestic losses that
Citi has incurred of approximately $54 billion as of December 31, 2015
are allowed to be reclassified as foreign source income to the extent of 50%
of domestic source income produced in subsequent years. Such resulting
foreign source income would cover the FTCs being carried forward. As
noted in the table above, Citi’s FTC carry-forwards were $15.9 billion as of
December 31, 2015, compared to $17.6 billion as of December 31, 2014. This
decrease represented $1.7 billion of the $1.5 billion decrease in Citi’s overall
DTAs during 2015, partially offset by an increase in AOCI related DTAs. Citi
believes that it will generate sufficient U.S. taxable income within the 10-year
carry-forward period to be able to fully utilize the FTCs, in addition to any
FTCs produced in the tax return for such period, which must be used prior to
any carry-forward utilization.