Citibank 2015 Annual Report Download - page 283
Download and view the complete annual report
Please find page 283 of the 2015 Citibank annual report below. You can navigate through the pages in the report by either clicking on the pages listed below, or by using the keyword search tool below to find specific information within the annual report.-
 1
1 -
2
-
3
-
4
-
5
-
6
-
7
-
8
-
9
-
10
-
11
-
12
-
13
-
14
-
15
-
16
-
17
-
18
-
19
-
20
-
21
-
22
-
23
-
24
-
25
-
26
-
27
-
28
-
29
-
30
-
31
-
32
-
33
-
34
-
35
-
36
-
37
-
38
-
39
-
40
-
41
-
42
-
43
-
44
-
45
-
46
-
47
-
48
-
49
-
50
-
51
-
52
-
53
-
54
-
55
-
56
-
57
-
58
-
59
-
60
-
61
-
62
-
63
-
64
-
65
-
66
-
67
-
68
-
69
-
70
-
71
-
72
-
73
-
74
-
75
-
76
-
77
-
78
-
79
-
80
-
81
-
82
-
83
-
84
-
85
-
86
-
87
-
88
-
89
-
90
-
91
-
92
-
93
-
94
-
95
-
96
-
97
-
98
-
99
-
100
-
101
-
102
-
103
-
104
-
105
-
106
-
107
-
108
-
109
-
110
-
111
-
112
-
113
-
114
-
115
-
116
-
117
-
118
-
119
-
120
-
121
-
122
-
123
-
124
-
125
-
126
-
127
-
128
-
129
-
130
-
131
-
132
-
133
-
134
-
135
-
136
-
137
-
138
-
139
-
140
-
141
-
142
-
143
-
144
-
145
-
146
-
147
-
148
-
149
-
150
-
151
-
152
-
153
-
154
-
155
-
156
-
157
-
158
-
159
-
160
-
161
-
162
-
163
-
164
-
165
-
166
-
167
-
168
-
169
-
170
-
171
-
172
-
173
-
174
-
175
-
176
-
177
-
178
-
179
-
180
-
181
-
182
-
183
-
184
-
185
-
186
-
187
-
188
-
189
-
190
-
191
-
192
-
193
-
194
-
195
-
196
-
197
-
198
-
199
-
200
-
201
-
202
-
203
-
204
-
205
-
206
-
207
-
208
-
209
-
210
-
211
-
212
-
213
-
214
-
215
-
216
-
217
-
218
-
219
-
220
-
221
-
222
-
223
-
224
-
225
-
226
-
227
-
228
-
229
-
230
-
231
-
232
-
233
-
234
-
235
-
236
-
237
-
238
-
239
-
240
-
241
-
242
-
243
-
244
-
245
-
246
-
247
-
248
-
249
-
250
-
251
-
252
-
253
-
254
-
255
-
256
-
257
-
258
-
259
-
260
-
261
-
262
-
263
-
264
-
265
-
266
-
267
-
268
-
269
-
270
-
271
-
272
-
 273
273 -
 274
274 -
 275
275 -
 276
276 -
 277
277 -
 278
278 -
 279
279 -
 280
280 -
 281
281 -
 282
282 -
 283
283 -
 284
284 -
 285
285 -
 286
286 -
 287
287 -
 288
288 -
 289
289 -
 290
290 -
 291
291 -
 292
292 -
 293
293 -
294
-
295
-
296
-
297
-
298
-
299
-
300
-
301
-
302
-
303
-
304
-
305
-
306
-
307
-
308
-
309
-
310
-
311
-
312
-
313
-
314
-
315
-
316
-
317
-
318
-
319
-
320
-
321
-
322
-
323
-
324
-
325
-
326
-
327
-
328
-
329
-
330
-
331
-
332
 |
 |

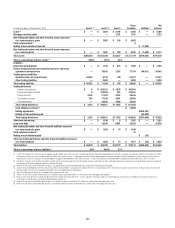
265
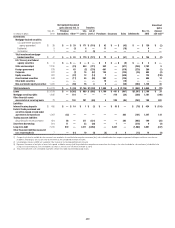
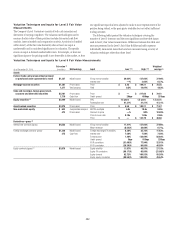
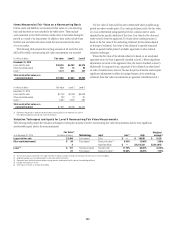
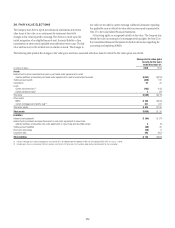
As of December 31, 2014
Fair value (1)
Methodology Input Low (2)(3) High (2)(3)
Weighted
average (4)
(in millions)
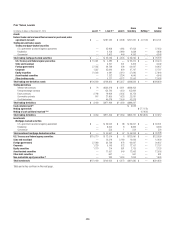
Non-trading derivatives and other financial
assets and liabilities measured on a
recurring basis (gross) (6) $ 74 Model-based Redemption rate 13.00% 99.50% 68.73%
Forward Price 107.00% 107.10% 107.05%
Loans $1,095 Cash flow Yield 1.60% 4.50% 2.23%
832 Model-based Price $ 4.72 $ 106.55 $ 98.56
740 Price-based Credit spread 35bps 500bps 199bps
441 Yield analysis
Mortgage servicing rights $1,750 Cash flow Yield 5.19% 21.40% 10.25%
WAL 3.31 years 7.89 years 5.17 years
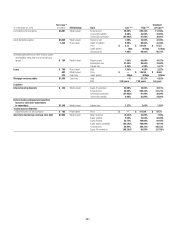
Liabilities
Interest-bearing deposits $ 486 Model-based Equity-IR correlation 34.00% 37.00% 35.43%
Commodity correlation (57.00)% 91.00% 30.00%
Commodity volatility 5.00% 83.00% 24.00%
Forward price 35.34% 268.77% 101.74%
Federal funds purchased and securities
loaned or sold under agreements to
repurchase $1,043 Model-based Interest rate 0.74% 2.26% 1.90%
Trading account liabilities
Securities sold, not yet purchased $ 251 Model-based Credit-IR correlation (70.49)% 8.81% 47.17%
$ 142 Price-based Price $ — $ 117.00 $ 70.33
Short-term borrowings and long-term debt $7,204 Model-based IR log-normal volatility 18.05% 90.65% 30.21%
Mean reversion 1.00% 20.00% 10.50%
Equity volatility 10.18% 69.65% 23.72%
Credit correlation 87.50% 87.50% 87.50%
Equity forward 89.50% 100.80% 95.80%
Forward price 35.34% 268.77% 101.80%
Commodity correlation (57.00)% 91.00% 30.00%
Commodity volatility 5.00% 83.00% 24.00%
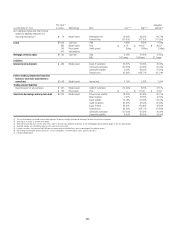
(1) The fair value amounts presented in these tables represent the primary valuation technique or techniques for each class of assets or liabilities.
(2) Some inputs are shown as zero due to rounding.
(3) When the low and high inputs are the same, there is either a constant input applied to all positions, or the methodology involving the input applies to only one large position.
(4) Weighted averages are calculated based on the fair values of the instruments.
(5) For equity securities, the price and fund NAV inputs are expressed on an absolute basis, not as a percentage of the notional amount.
(6) Both trading and nontrading account derivatives—assets and liabilities—are presented on a gross absolute value basis.
(7) Includes hybrid products.