Citibank 2015 Annual Report Download - page 104
Download and view the complete annual report
Please find page 104 of the 2015 Citibank annual report below. You can navigate through the pages in the report by either clicking on the pages listed below, or by using the keyword search tool below to find specific information within the annual report.-
 1
1 -
2
-
3
-
4
-
5
-
6
-
7
-
8
-
9
-
10
-
11
-
12
-
13
-
14
-
15
-
16
-
17
-
18
-
19
-
20
-
21
-
22
-
23
-
24
-
25
-
26
-
27
-
28
-
29
-
30
-
31
-
32
-
33
-
34
-
35
-
36
-
37
-
38
-
39
-
40
-
41
-
42
-
43
-
44
-
45
-
46
-
47
-
48
-
49
-
50
-
51
-
52
-
53
-
54
-
55
-
56
-
57
-
58
-
59
-
60
-
61
-
62
-
63
-
64
-
65
-
66
-
67
-
68
-
69
-
70
-
71
-
72
-
73
-
74
-
75
-
76
-
77
-
78
-
79
-
80
-
81
-
82
-
83
-
84
-
85
-
86
-
87
-
88
-
89
-
90
-
91
-
92
-
93
-
 94
94 -
 95
95 -
 96
96 -
 97
97 -
 98
98 -
 99
99 -
 100
100 -
 101
101 -
 102
102 -
 103
103 -
 104
104 -
 105
105 -
 106
106 -
 107
107 -
 108
108 -
 109
109 -
 110
110 -
 111
111 -
 112
112 -
 113
113 -
 114
114 -
115
-
116
-
117
-
118
-
119
-
120
-
121
-
122
-
123
-
124
-
125
-
126
-
127
-
128
-
129
-
130
-
131
-
132
-
133
-
134
-
135
-
136
-
137
-
138
-
139
-
140
-
141
-
142
-
143
-
144
-
145
-
146
-
147
-
148
-
149
-
150
-
151
-
152
-
153
-
154
-
155
-
156
-
157
-
158
-
159
-
160
-
161
-
162
-
163
-
164
-
165
-
166
-
167
-
168
-
169
-
170
-
171
-
172
-
173
-
174
-
175
-
176
-
177
-
178
-
179
-
180
-
181
-
182
-
183
-
184
-
185
-
186
-
187
-
188
-
189
-
190
-
191
-
192
-
193
-
194
-
195
-
196
-
197
-
198
-
199
-
200
-
201
-
202
-
203
-
204
-
205
-
206
-
207
-
208
-
209
-
210
-
211
-
212
-
213
-
214
-
215
-
216
-
217
-
218
-
219
-
220
-
221
-
222
-
223
-
224
-
225
-
226
-
227
-
228
-
229
-
230
-
231
-
232
-
233
-
234
-
235
-
236
-
237
-
238
-
239
-
240
-
241
-
242
-
243
-
244
-
245
-
246
-
247
-
248
-
249
-
250
-
251
-
252
-
253
-
254
-
255
-
256
-
257
-
258
-
259
-
260
-
261
-
262
-
263
-
264
-
265
-
266
-
267
-
268
-
269
-
270
-
271
-
272
-
273
-
274
-
275
-
276
-
277
-
278
-
279
-
280
-
281
-
282
-
283
-
284
-
285
-
286
-
287
-
288
-
289
-
290
-
291
-
292
-
293
-
294
-
295
-
296
-
297
-
298
-
299
-
300
-
301
-
302
-
303
-
304
-
305
-
306
-
307
-
308
-
309
-
310
-
311
-
312
-
313
-
314
-
315
-
316
-
317
-
318
-
319
-
320
-
321
-
322
-
323
-
324
-
325
-
326
-
327
-
328
-
329
-
330
-
331
-
332
 |
 |

86
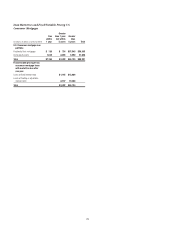
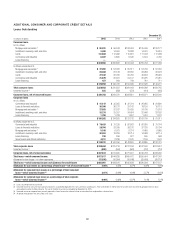
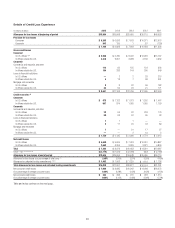
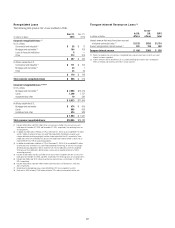
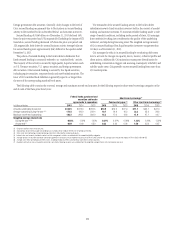
The table below summarizes Citigroup’s other real estate owned (OREO) assets as of the periods indicated. This represents the carrying value of all real estate
property acquired by foreclosure or other legal proceedings when Citi has taken possession of the collateral:
December 31,
In millions of dollars 2015 2014 2013 2012 2011
OREO (1)
Citicorp $ 71 $92 $ 75 $ 39 $ 65
Citi Holdings 138 168 342 401 501
Total OREO $ 209 $ 260 $ 417 $ 440 $ 566
North America $ 166 $ 195 $ 305 $ 299 $ 441
EMEA 18 59 99 73
Latin America 38 47 47 40 51
Asia 410 6 2 1
Total OREO $ 209 $ 260 $ 417 $ 440 $ 566
Other repossessed assets $ — $ — $ — $ 1 $ 1
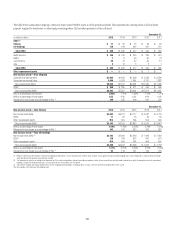
Non-accrual assets—Total Citigroup
Corporate non-accrual loans $1,564 $1,183 $1,908 $ 2,333 $ 3,236
Consumer non-accrual loans 3,690 5,924 7,095 9,197 7,832
Non-accrual loans (NAL) $5,254 $7,107 $9,003 $11,530 $11,068
OREO $ 209 $ 260 $ 417 $ 440 $ 566
Non-accrual assets (NAA) $5,463 $7,367 $9,420 $11,971 $11,635
NAL as a percentage of total loans 0.85% 1.10% 1.35% 1.76% 1.71%
NAA as a percentage of total assets 0.32 0.40 0.50 0.64 0.62
Allowance for loan losses as a percentage of NAL (2) 240 225 218 221 272
December 31,
Non-accrual assets—Total Citicorp 2015 2014 2013 2012 2011
Non-accrual loans (NAL) $3,092 $3,011 $3,777 $ 4,031 $ 3,776
OREO 71 92 75 39 65
Other repossessed assets N/A N/A N/A N/A N/A
Non-accrual assets (NAA) $3,163 $3,103 $3,852 $ 4,070 $ 3,841
NAA as a percentage of total assets 0.19% 0.18% 0.22% 0.24% 0.24%
Allowance for loan losses as a percentage of NAL (2) 343 370 339 353 431
Non-accrual assets—Total Citi Holdings
Non-accrual loans (NAL) (3) $2,162 $4,096 $5,226 $ 7,499 $ 7,292
OREO 138 168 342 401 501
Other repossessed assets N/A N/A N/A N/A N/A
Non-accrual assets (NAA) $2,300 $4,264 $5,568 $ 7,900 $ 7,793
NAA as a percentage of total assets 3.11% 3.31% 3.62% 4.01% 3.00%
Allowance for loan losses as a percentage of NAL (2) 93 118 131 150 190
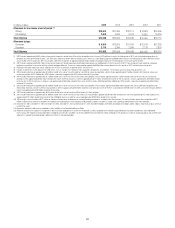
(1) Reflects a decrease of $130 million related to the adoption of ASU 2014-14 in the fourth quarter of 2014, which requires certain government guaranteed mortgage loans to be recognized as separate other receivables
upon foreclosure. Prior periods have not been restated.
(2) The allowance for loan losses includes the allowance for Citi’s credit card portfolios and purchased distressed loans, while the non-accrual loans exclude credit card balances (with the exception of certain international
portfolios) and purchased distressed loans as these continue to accrue interest until charge-off.
(3) 2015 decline includes the impact related to the transfer of approximately $8 billion of mortgage loans to Loans, held-for-sale (HFS) (included within Other assets).
N/A Not available at the Citicorp or Citi Holdings level.