Citibank 2015 Annual Report Download - page 116
Download and view the complete annual report
Please find page 116 of the 2015 Citibank annual report below. You can navigate through the pages in the report by either clicking on the pages listed below, or by using the keyword search tool below to find specific information within the annual report.-
 1
1 -
2
-
3
-
4
-
5
-
6
-
7
-
8
-
9
-
10
-
11
-
12
-
13
-
14
-
15
-
16
-
17
-
18
-
19
-
20
-
21
-
22
-
23
-
24
-
25
-
26
-
27
-
28
-
29
-
30
-
31
-
32
-
33
-
34
-
35
-
36
-
37
-
38
-
39
-
40
-
41
-
42
-
43
-
44
-
45
-
46
-
47
-
48
-
49
-
50
-
51
-
52
-
53
-
54
-
55
-
56
-
57
-
58
-
59
-
60
-
61
-
62
-
63
-
64
-
65
-
66
-
67
-
68
-
69
-
70
-
71
-
72
-
73
-
74
-
75
-
76
-
77
-
78
-
79
-
80
-
81
-
82
-
83
-
84
-
85
-
86
-
87
-
88
-
89
-
90
-
91
-
92
-
93
-
94
-
95
-
96
-
97
-
98
-
99
-
100
-
101
-
102
-
103
-
104
-
105
-
 106
106 -
 107
107 -
 108
108 -
 109
109 -
 110
110 -
 111
111 -
 112
112 -
 113
113 -
 114
114 -
 115
115 -
 116
116 -
 117
117 -
 118
118 -
 119
119 -
 120
120 -
 121
121 -
 122
122 -
 123
123 -
 124
124 -
 125
125 -
 126
126 -
127
-
128
-
129
-
130
-
131
-
132
-
133
-
134
-
135
-
136
-
137
-
138
-
139
-
140
-
141
-
142
-
143
-
144
-
145
-
146
-
147
-
148
-
149
-
150
-
151
-
152
-
153
-
154
-
155
-
156
-
157
-
158
-
159
-
160
-
161
-
162
-
163
-
164
-
165
-
166
-
167
-
168
-
169
-
170
-
171
-
172
-
173
-
174
-
175
-
176
-
177
-
178
-
179
-
180
-
181
-
182
-
183
-
184
-
185
-
186
-
187
-
188
-
189
-
190
-
191
-
192
-
193
-
194
-
195
-
196
-
197
-
198
-
199
-
200
-
201
-
202
-
203
-
204
-
205
-
206
-
207
-
208
-
209
-
210
-
211
-
212
-
213
-
214
-
215
-
216
-
217
-
218
-
219
-
220
-
221
-
222
-
223
-
224
-
225
-
226
-
227
-
228
-
229
-
230
-
231
-
232
-
233
-
234
-
235
-
236
-
237
-
238
-
239
-
240
-
241
-
242
-
243
-
244
-
245
-
246
-
247
-
248
-
249
-
250
-
251
-
252
-
253
-
254
-
255
-
256
-
257
-
258
-
259
-
260
-
261
-
262
-
263
-
264
-
265
-
266
-
267
-
268
-
269
-
270
-
271
-
272
-
273
-
274
-
275
-
276
-
277
-
278
-
279
-
280
-
281
-
282
-
283
-
284
-
285
-
286
-
287
-
288
-
289
-
290
-
291
-
292
-
293
-
294
-
295
-
296
-
297
-
298
-
299
-
300
-
301
-
302
-
303
-
304
-
305
-
306
-
307
-
308
-
309
-
310
-
311
-
312
-
313
-
314
-
315
-
316
-
317
-
318
-
319
-
320
-
321
-
322
-
323
-
324
-
325
-
326
-
327
-
328
-
329
-
330
-
331
-
332
 |
 |

98
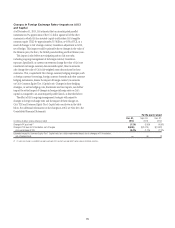
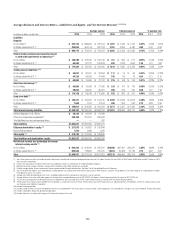
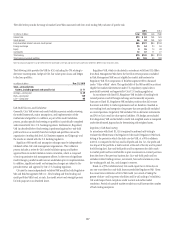
The following table sets forth the estimated impact to Citi’s net interest revenue, AOCI and the Common Equity Tier 1 Capital ratio (on a fully implemented
basis), each assuming an unanticipated parallel instantaneous 100 basis point increase in interest rates.
In millions of dollars (unless otherwise noted)
Dec. 31,
2015
Sept. 30,
2015
Dec. 31,
2014
Estimated annualized impact to net interest revenue
U.S. dollar (1) $ 1,419 $ 1,533 $ 1,123
All other currencies 635 616 629
Total $ 2,054 $ 2,149 $ 1,752
As a percentage of average interest-earning assets 0.13% 0.13% 0.11%
Estimated initial impact to AOCI (after-tax) (2) $(4,837) $(4,450) $(3,961)
Estimated initial impact on Common Equity Tier 1 Capital ratio (bps) (3) (57) (50) (44)
(1) Certain trading-oriented businesses within Citi have accrual-accounted positions that are excluded from the estimated impact to net interest revenue in the table since these exposures are managed economically
in combination with mark-to-market positions. The U.S. dollar interest rate exposure associated with these businesses was $(211) million for a 100 basis point instantaneous increase in interest rates as of
December 31, 2015.
(2) Includes the effect of changes in interest rates on AOCI related to investment securities, cash flow hedges and pension liability adjustments.
(3) The estimated initial impact to the Common Equity Tier 1 Capital ratio considers the effect of Citi’s deferred tax asset position and is based on only the estimated initial AOCI impact above.
The sequential decrease in the estimated impact to net interest revenue
primarily reflected Citi Treasury actions, offset by an increase in certain
of Citi’s deposit balances and an increasing capital base. The sequential
increase in the estimated impact to AOCI and the Common Equity Tier 1
Capital ratio primarily reflected changes in the composition of Citi Treasury’s
investment and interest rate derivatives portfolio.
In the event of an unanticipated parallel instantaneous 100 basis point
increase in interest rates, Citi expects the negative impact to AOCI would
be offset in shareholders’ equity through the combination of expected
incremental net interest revenue and the expected recovery of the impact on
AOCI through accretion of Citi’s investment portfolio over a period of time.
As of December 31, 2015, Citi expects that the negative $4.8 billion impact
to AOCI in such a scenario could potentially be offset over approximately
22 months.
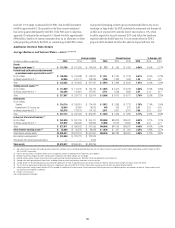
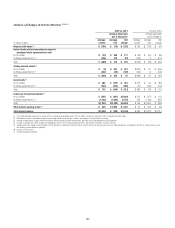
The following table sets forth the estimated impact to Citi’s net interest
revenue, AOCI and the Common Equity Tier 1 Capital ratio (on a fully
implemented basis) under four different changes in interest rate scenarios for
the U.S. dollar and Citi’s other currencies.
In millions of dollars (unless otherwise noted) Scenario 1 Scenario 2 Scenario 3 Scenario 4
Overnight rate change (bps) 100 100 — —
10-year rate change (bps) 100 — 100 (100)
Estimated annualized impact to net interest revenue
U.S. dollar $ 1,419 $ 1,346 $ 100 $ (172)
All other currencies 635 580 36 (36)
Total $ 2,054 $ 1,926 $ 136 $ (208)
Estimated initial impact to AOCI (after-tax) (1) $(4,837) $(2,893) $(2,212) $1,845
Estimated initial impact to Common Equity Tier 1 Capital ratio (bps) (2) (57) (34) (26) 22
Note: Each scenario in the table above assumes that the rate change will occur instantaneously. Changes in interest rates for maturities between the overnight rate and the 10-year rate are interpolated.
(1) Includes the effect of changes in interest rates on AOCI related to investment securities, cash flow hedges and pension liability adjustments.
(2) The estimated initial impact to the Common Equity Tier 1 Capital ratio considers the effect of Citi’s deferred tax asset position and is based on only the estimated AOCI impact above.
As shown in the table above, the magnitude of the impact to Citi’s net
interest revenue and AOCI is greater under scenario 2 as compared to
scenario 3. This is because the combination of changes to Citi’s investment
portfolio, partially offset by changes related to Citi’s pension liabilities, results
in a net position that is more sensitive to rates at shorter and intermediate
term maturities.