Citibank 2015 Annual Report Download - page 298
Download and view the complete annual report
Please find page 298 of the 2015 Citibank annual report below. You can navigate through the pages in the report by either clicking on the pages listed below, or by using the keyword search tool below to find specific information within the annual report.-
 1
1 -
2
-
3
-
4
-
5
-
6
-
7
-
8
-
9
-
10
-
11
-
12
-
13
-
14
-
15
-
16
-
17
-
18
-
19
-
20
-
21
-
22
-
23
-
24
-
25
-
26
-
27
-
28
-
29
-
30
-
31
-
32
-
33
-
34
-
35
-
36
-
37
-
38
-
39
-
40
-
41
-
42
-
43
-
44
-
45
-
46
-
47
-
48
-
49
-
50
-
51
-
52
-
53
-
54
-
55
-
56
-
57
-
58
-
59
-
60
-
61
-
62
-
63
-
64
-
65
-
66
-
67
-
68
-
69
-
70
-
71
-
72
-
73
-
74
-
75
-
76
-
77
-
78
-
79
-
80
-
81
-
82
-
83
-
84
-
85
-
86
-
87
-
88
-
89
-
90
-
91
-
92
-
93
-
94
-
95
-
96
-
97
-
98
-
99
-
100
-
101
-
102
-
103
-
104
-
105
-
106
-
107
-
108
-
109
-
110
-
111
-
112
-
113
-
114
-
115
-
116
-
117
-
118
-
119
-
120
-
121
-
122
-
123
-
124
-
125
-
126
-
127
-
128
-
129
-
130
-
131
-
132
-
133
-
134
-
135
-
136
-
137
-
138
-
139
-
140
-
141
-
142
-
143
-
144
-
145
-
146
-
147
-
148
-
149
-
150
-
151
-
152
-
153
-
154
-
155
-
156
-
157
-
158
-
159
-
160
-
161
-
162
-
163
-
164
-
165
-
166
-
167
-
168
-
169
-
170
-
171
-
172
-
173
-
174
-
175
-
176
-
177
-
178
-
179
-
180
-
181
-
182
-
183
-
184
-
185
-
186
-
187
-
188
-
189
-
190
-
191
-
192
-
193
-
194
-
195
-
196
-
197
-
198
-
199
-
200
-
201
-
202
-
203
-
204
-
205
-
206
-
207
-
208
-
209
-
210
-
211
-
212
-
213
-
214
-
215
-
216
-
217
-
218
-
219
-
220
-
221
-
222
-
223
-
224
-
225
-
226
-
227
-
228
-
229
-
230
-
231
-
232
-
233
-
234
-
235
-
236
-
237
-
238
-
239
-
240
-
241
-
242
-
243
-
244
-
245
-
246
-
247
-
248
-
249
-
250
-
251
-
252
-
253
-
254
-
255
-
256
-
257
-
258
-
259
-
260
-
261
-
262
-
263
-
264
-
265
-
266
-
267
-
268
-
269
-
270
-
271
-
272
-
273
-
274
-
275
-
276
-
277
-
278
-
279
-
280
-
281
-
282
-
283
-
284
-
285
-
286
-
287
-
 288
288 -
 289
289 -
 290
290 -
 291
291 -
 292
292 -
 293
293 -
 294
294 -
 295
295 -
 296
296 -
 297
297 -
 298
298 -
 299
299 -
 300
300 -
 301
301 -
 302
302 -
 303
303 -
 304
304 -
 305
305 -
 306
306 -
 307
307 -
 308
308 -
309
-
310
-
311
-
312
-
313
-
314
-
315
-
316
-
317
-
318
-
319
-
320
-
321
-
322
-
323
-
324
-
325
-
326
-
327
-
328
-
329
-
330
-
331
-
332
 |
 |

280
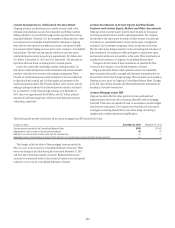
Carrying Value—Guarantees and Indemnifications
At December 31, 2015 and 2014, the total carrying amounts of the liabilities
related to the guarantees and indemnifications included in the tables above
amounted to approximately $2.0 billion and $3.1 billion, respectively. The
carrying value of financial and performance guarantees is included in Other
liabilities, as is the carrying value of the liability for loans sold with recourse.
Collateral
Cash collateral available to Citi to reimburse losses realized under these
guarantees and indemnifications amounted to $52 billion and $63 billion at
December 31, 2015 and 2014, respectively. Securities and other marketable
assets held as collateral amounted to $33 billion and $59 billion at
December 31, 2015 and 2014, respectively. The majority of collateral is
held to reimburse losses realized under securities lending indemnifications.
Additionally, letters of credit in favor of Citi held as collateral amounted to
$4.2 billion and $4.0 billion at December 31, 2015 and 2014, respectively.
Other property may also be available to Citi to cover losses under certain
guarantees and indemnifications; however, the value of such property has
not been determined.
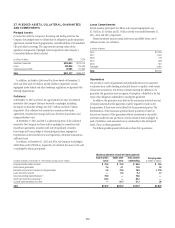
Performance risk
Citi evaluates the performance risk of its guarantees based on the assigned
referenced counterparty internal or external ratings. Where external ratings
are used, investment-grade ratings are considered to be Baa/BBB and above,
while anything below is considered non-investment grade. Citi’s internal
ratings are in line with the related external rating system. On certain
underlying referenced assets or entities, ratings are not available. Such
referenced assets are included in the “not rated” category. The maximum
potential amount of the future payments related to the outstanding
guarantees is determined to be the notional amount of these contracts, which
is the par amount of the assets guaranteed.
Presented in the tables below are the maximum potential amounts of
future payments that are classified based upon internal and external credit
ratings. As previously mentioned, the determination of the maximum
potential future payments is based on the notional amount of the guarantees
without consideration of possible recoveries under recourse provisions or
from collateral held or pledged. As such, Citi believes such amounts bear no
relationship to the anticipated losses, if any, on these guarantees.
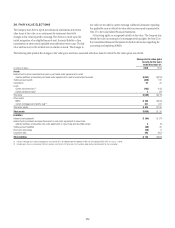
Maximum potential amount of future payments
In billions of dollars at December 31, 2015
Investment
grade
Non-investment
grade
Not
rated Total
Financial standby letters of credit $ 69.2 $15.4 $ 12.2 $ 96.8
Performance guarantees 6.6 4.1 0.8 11.5
Derivative instruments deemed to be guarantees — — 78.5 78.5
Loans sold with recourse — — 0.2 0.2
Securities lending indemnifications — — 79.0 79.0
Credit card merchant processing — — 84.2 84.2
Custody indemnifications and other 51.6 0.1 — 51.7
Total $127.4 $19.6 $254.9 $401.9
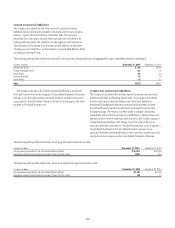
Maximum potential amount of future payments
In billions of dollars at December 31, 2014
Investment
grade
Non-investment
grade
Not
rated Total
Financial standby letters of credit $ 73.0 $15.9 $ 9.5 $ 98.4
Performance guarantees 7.3 3.9 0.7 11.9
Derivative instruments deemed to be guarantees — — 91.7 91.7
Loans sold with recourse — — 0.2 0.2
Securities lending indemnifications — — 115.9 115.9
Credit card merchant processing — — 86.0 86.0
Custody indemnifications and other 48.8 0.1 — 48.9
Total $129.1 $19.9 $304.0 $453.0