Citibank 2015 Annual Report Download - page 203
Download and view the complete annual report
Please find page 203 of the 2015 Citibank annual report below. You can navigate through the pages in the report by either clicking on the pages listed below, or by using the keyword search tool below to find specific information within the annual report.-
 1
1 -
2
-
3
-
4
-
5
-
6
-
7
-
8
-
9
-
10
-
11
-
12
-
13
-
14
-
15
-
16
-
17
-
18
-
19
-
20
-
21
-
22
-
23
-
24
-
25
-
26
-
27
-
28
-
29
-
30
-
31
-
32
-
33
-
34
-
35
-
36
-
37
-
38
-
39
-
40
-
41
-
42
-
43
-
44
-
45
-
46
-
47
-
48
-
49
-
50
-
51
-
52
-
53
-
54
-
55
-
56
-
57
-
58
-
59
-
60
-
61
-
62
-
63
-
64
-
65
-
66
-
67
-
68
-
69
-
70
-
71
-
72
-
73
-
74
-
75
-
76
-
77
-
78
-
79
-
80
-
81
-
82
-
83
-
84
-
85
-
86
-
87
-
88
-
89
-
90
-
91
-
92
-
93
-
94
-
95
-
96
-
97
-
98
-
99
-
100
-
101
-
102
-
103
-
104
-
105
-
106
-
107
-
108
-
109
-
110
-
111
-
112
-
113
-
114
-
115
-
116
-
117
-
118
-
119
-
120
-
121
-
122
-
123
-
124
-
125
-
126
-
127
-
128
-
129
-
130
-
131
-
132
-
133
-
134
-
135
-
136
-
137
-
138
-
139
-
140
-
141
-
142
-
143
-
144
-
145
-
146
-
147
-
148
-
149
-
150
-
151
-
152
-
153
-
154
-
155
-
156
-
157
-
158
-
159
-
160
-
161
-
162
-
163
-
164
-
165
-
166
-
167
-
168
-
169
-
170
-
171
-
172
-
173
-
174
-
175
-
176
-
177
-
178
-
179
-
180
-
181
-
182
-
183
-
184
-
185
-
186
-
187
-
188
-
189
-
190
-
191
-
192
-
 193
193 -
 194
194 -
 195
195 -
 196
196 -
 197
197 -
 198
198 -
 199
199 -
 200
200 -
 201
201 -
 202
202 -
 203
203 -
 204
204 -
 205
205 -
 206
206 -
 207
207 -
 208
208 -
 209
209 -
 210
210 -
 211
211 -
 212
212 -
 213
213 -
214
-
215
-
216
-
217
-
218
-
219
-
220
-
221
-
222
-
223
-
224
-
225
-
226
-
227
-
228
-
229
-
230
-
231
-
232
-
233
-
234
-
235
-
236
-
237
-
238
-
239
-
240
-
241
-
242
-
243
-
244
-
245
-
246
-
247
-
248
-
249
-
250
-
251
-
252
-
253
-
254
-
255
-
256
-
257
-
258
-
259
-
260
-
261
-
262
-
263
-
264
-
265
-
266
-
267
-
268
-
269
-
270
-
271
-
272
-
273
-
274
-
275
-
276
-
277
-
278
-
279
-
280
-
281
-
282
-
283
-
284
-
285
-
286
-
287
-
288
-
289
-
290
-
291
-
292
-
293
-
294
-
295
-
296
-
297
-
298
-
299
-
300
-
301
-
302
-
303
-
304
-
305
-
306
-
307
-
308
-
309
-
310
-
311
-
312
-
313
-
314
-
315
-
316
-
317
-
318
-
319
-
320
-
321
-
322
-
323
-
324
-
325
-
326
-
327
-
328
-
329
-
330
-
331
-
332
 |
 |

185
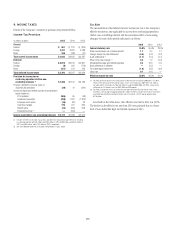
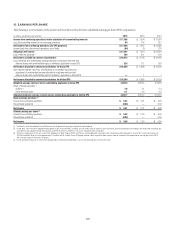
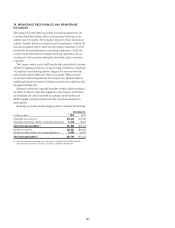
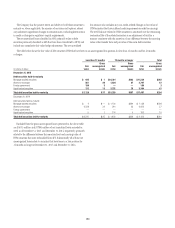
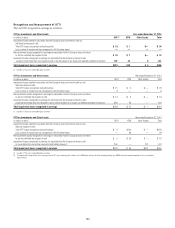
14. INVESTMENTS
Overview
The following table presents the Company’s investments by category:
December 31,
In millions of dollars 2015 2014
Securities available-for-sale (AFS) $299,136 $300,143
Debt securities held-to-maturity (HTM) (1) 36,215 23,921
Non-marketable equity securities carried at fair value (2) 2,088 2,758
Non-marketable equity securities carried at cost (3) 5,516 6,621
Total investments $342,955 $333,443
(1) Carried at adjusted amortized cost basis, net of any credit-related impairment.
(2) Unrealized gains and losses for non-marketable equity securities carried at fair value are recognized in earnings.
(3) Primarily consists of shares issued by the Federal Reserve Bank, Federal Home Loan Banks, foreign central banks and various clearing houses of which Citigroup is a member.
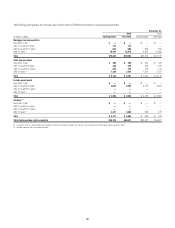
The following table presents interest and dividend income on investments:
In millions of dollars 2015 2014 2013
Taxable interest $ 6,414 $ 6,311 $ 5,750
Interest exempt from U.S. federal income tax 215 439 732
Dividend income 388 445 437
Total interest and dividends $7,017 $ 7,195 $ 6,919
The following table presents realized gains and losses on the sale of
investments. The gross realized investment losses exclude losses from other-
than-temporary impairment (OTTI):
In millions of dollars 2015 2014 2013
Gross realized investment gains $1,124 $1,020 $1,606
Gross realized investment losses (442) (450) (858)
Net realized gains on sale of investments $ 682 $ 570 $ 748
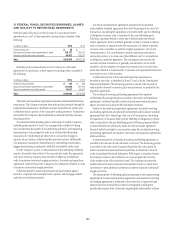
The Company has sold certain debt securities that were classified as
HTM. These sales were in response to significant deterioration in the
creditworthiness of the issuers or securities or because the Company has
collected a substantial portion (at least 85%) of the principal outstanding
at acquisition of the security. In addition, certain other securities were
reclassified to AFS investments in response to significant credit deterioration.
Because the Company generally intends to sell these reclassified securities,
Citi recorded OTTI on the securities. The following table sets forth, for the
periods indicated, the carrying value of HTM securities sold and reclassified
to AFS, as well as the related gain (loss) or the OTTI losses recorded on
these securities.
In millions of dollars 2015 2014 2013
Carrying value of HTM securities sold $392 $ 8 $ 935
Net realized gain (loss) on sale of HTM securities 10 — (128)
Carrying value of securities reclassified to AFS 243 889 989
OTTI losses on securities reclassified to AFS (15) (25) (156)