Citibank 2015 Annual Report Download - page 44
Download and view the complete annual report
Please find page 44 of the 2015 Citibank annual report below. You can navigate through the pages in the report by either clicking on the pages listed below, or by using the keyword search tool below to find specific information within the annual report.-
 1
1 -
2
-
3
-
4
-
5
-
6
-
7
-
8
-
9
-
10
-
11
-
12
-
13
-
14
-
15
-
16
-
17
-
18
-
19
-
20
-
21
-
22
-
23
-
24
-
25
-
26
-
27
-
28
-
29
-
30
-
31
-
32
-
33
-
 34
34 -
 35
35 -
 36
36 -
 37
37 -
 38
38 -
 39
39 -
 40
40 -
 41
41 -
 42
42 -
 43
43 -
 44
44 -
 45
45 -
 46
46 -
 47
47 -
 48
48 -
 49
49 -
 50
50 -
 51
51 -
 52
52 -
 53
53 -
 54
54 -
55
-
56
-
57
-
58
-
59
-
60
-
61
-
62
-
63
-
64
-
65
-
66
-
67
-
68
-
69
-
70
-
71
-
72
-
73
-
74
-
75
-
76
-
77
-
78
-
79
-
80
-
81
-
82
-
83
-
84
-
85
-
86
-
87
-
88
-
89
-
90
-
91
-
92
-
93
-
94
-
95
-
96
-
97
-
98
-
99
-
100
-
101
-
102
-
103
-
104
-
105
-
106
-
107
-
108
-
109
-
110
-
111
-
112
-
113
-
114
-
115
-
116
-
117
-
118
-
119
-
120
-
121
-
122
-
123
-
124
-
125
-
126
-
127
-
128
-
129
-
130
-
131
-
132
-
133
-
134
-
135
-
136
-
137
-
138
-
139
-
140
-
141
-
142
-
143
-
144
-
145
-
146
-
147
-
148
-
149
-
150
-
151
-
152
-
153
-
154
-
155
-
156
-
157
-
158
-
159
-
160
-
161
-
162
-
163
-
164
-
165
-
166
-
167
-
168
-
169
-
170
-
171
-
172
-
173
-
174
-
175
-
176
-
177
-
178
-
179
-
180
-
181
-
182
-
183
-
184
-
185
-
186
-
187
-
188
-
189
-
190
-
191
-
192
-
193
-
194
-
195
-
196
-
197
-
198
-
199
-
200
-
201
-
202
-
203
-
204
-
205
-
206
-
207
-
208
-
209
-
210
-
211
-
212
-
213
-
214
-
215
-
216
-
217
-
218
-
219
-
220
-
221
-
222
-
223
-
224
-
225
-
226
-
227
-
228
-
229
-
230
-
231
-
232
-
233
-
234
-
235
-
236
-
237
-
238
-
239
-
240
-
241
-
242
-
243
-
244
-
245
-
246
-
247
-
248
-
249
-
250
-
251
-
252
-
253
-
254
-
255
-
256
-
257
-
258
-
259
-
260
-
261
-
262
-
263
-
264
-
265
-
266
-
267
-
268
-
269
-
270
-
271
-
272
-
273
-
274
-
275
-
276
-
277
-
278
-
279
-
280
-
281
-
282
-
283
-
284
-
285
-
286
-
287
-
288
-
289
-
290
-
291
-
292
-
293
-
294
-
295
-
296
-
297
-
298
-
299
-
300
-
301
-
302
-
303
-
304
-
305
-
306
-
307
-
308
-
309
-
310
-
311
-
312
-
313
-
314
-
315
-
316
-
317
-
318
-
319
-
320
-
321
-
322
-
323
-
324
-
325
-
326
-
327
-
328
-
329
-
330
-
331
-
332
 |
 |
26
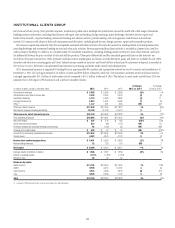
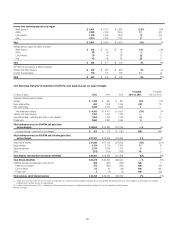
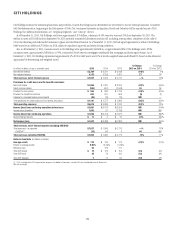
The discussion of the results of operations for ICG below excludes the impact of CVA/DVA for all periods presented. Presentations of the results of
operations, excluding the impact of CVA/DVA and the impact of gains/(losses) on hedges on accrual loans, are non-GAAP financial measures. For a
reconciliation of these metrics to the reported results, see the table above.
2015 vs. 2014
Net income decreased 4%, primarily driven by higher credit costs, partially
offset by lower expenses.
• Revenues were largely unchanged, reflecting lower revenues in Markets
and securities services (decrease of 1%) and a modest increase in
revenues in Banking (increase of 1%, but unchanged excluding the
gains/(losses) on hedges on accrual loans). Citi expects revenues in ICG,
particularly in its Markets and securities services businesses, will likely
continue to reflect the overall market environment.
Within Banking:
• Investment banking revenues decreased 3%, largely reflecting an
industry-wide activity decline in underwriting activity. Advisory revenues
increased 16%, reflecting increased target client activity and strength in
the overall M&A market. Equity underwriting revenues decreased 28%
driven by the lower market activity and a decline in wallet share resulting
from continued share fragmentation. Debt underwriting revenues
increased 1%, driven by increased wallet share in investment grade debt
and strong performance in investment grade loans in the second half of
2015, partially offset by the lower market activity and decreased wallet
share in high-yield and leveraged loans.
• Treasury and trade solutions revenues were largely unchanged.
Excluding the impact of FX translation, revenues increased 6%, as
continued growth in deposit balances across regions and improved
spreads, particularly in North America, were partially offset by continued
declines in trade balances and spreads. End-of-period deposit balances
increased 3% (7% excluding the impact of FX translation), largely driven
by Asia and Latin America. Average trade loans decreased 12% (9%
excluding the impact of FX translation), as the business maintained
origination volumes while reducing lower spread assets and increasing
asset sales to optimize returns (see “Managing Global Risk—Liquidity
Risk” below).
• Corporate lending revenues increased 8%. Excluding the impact of
gains/(losses) on hedges on accrual loans, revenues decreased 3%.
Excluding the impact of FX translation and gains/(losses) on hedges on
accrual loans, revenues increased 3% as continued growth in average loan
balances, lower hedge premium costs and an improvement in mark-to-
market adjustments were partially offset by lower spreads, particularly
in EMEA.
• Private bank revenues increased 8%, reflecting strength in North
America, Asia and EMEA, primarily due to growth in loan volumes and
deposit balances, improved spreads in banking and higher managed
investments revenues, partially offset by continued spread compression
in lending.
Within Markets and securities services:
• Fixed income markets revenues decreased 7%, driven by North America,
primarily due to a volatile trading environment during 2015 due to
macroeconomic uncertainty. The decrease in fixed income markets
revenues resulted from a decline in spread products revenues (credit
markets, securitized markets and municipals), partially offset by strength
in rates and currencies. Rates and currencies revenues increased 4% due
to higher revenues in local markets and overall G10 products, partially
offset by G10 foreign exchange.
• Equity markets revenues increased 13%, primarily reflecting improved
performance across products, including derivatives and prime finance,
with strength in Asia and EMEA.
• Securities services revenues increased 4%. Excluding the impact of FX
translation, revenues increased 15%, reflecting increased client activity
and higher client balances.
Expenses decreased 2% as efficiency savings, the impact of FX translation
and lower repositioning charges were partially offset by increased regulatory
and compliance costs and compensation expense.
Provisions increased $872 million to $929 million, primarily reflecting
a net loan loss reserve build ($722 million), compared to a net loan loss
reserve release ($219 million) in 2014. The net loan loss reserve build
included approximately $530 million for energy and energy-related
exposures, including $250 million in the fourth quarter of 2015, due to the
significant decline in commodity prices during the second half of 2015.
(For additional information on Citi’s energy and energy-related exposures,
see “Managing Global Risk—Credit Risk—Corporate Credit” below.) The
remainder of the build during 2015 was primarily due to volume growth and
overall macroeconomic conditions.
The higher net loan loss reserve build during 2015 was partially offset
by lower net credit losses. Net credit losses decreased 25%, primarily due to
the absence of net credit losses of approximately $165 million related to the
Petróleos Mexicanos (Pemex) supplier program, which were incurred during
2014 (for additional information, see Citi’s Form 8-K filed with the SEC
on February 28, 2014), partially offset by increased net credit losses related
to a limited number of energy and energy-related exposures, including
approximately $75 million in the fourth quarter of 2015.
Looking to 2016, cost of credit in ICG will largely depend on the price of
oil and other commodity prices as well as macroeconomic conditions. To
the extent commodity prices remain at year-end 2015 levels, or deteriorate
further, ICG expects to incur additional loan loss reserve builds in its
energy and energy-related portfolios, which could be significant, and Citi’s
corporate non-accrual loans could be negatively impacted. Such events as
well as macroeconomic conditions could also negatively impact Citi’s other
corporate credit portfolios.