Citibank 2015 Annual Report Download - page 93
Download and view the complete annual report
Please find page 93 of the 2015 Citibank annual report below. You can navigate through the pages in the report by either clicking on the pages listed below, or by using the keyword search tool below to find specific information within the annual report.-
 1
1 -
 2
2 -
 3
3 -
 4
4 -
 5
5 -
 6
6 -
 7
7 -
 8
8 -
 9
9 -
 10
10 -
 11
11 -
 12
12 -
 13
13 -
 14
14 -
 15
15 -
 16
16 -
 17
17 -
 18
18 -
 19
19 -
 20
20 -
 21
21 -
 22
22 -
 23
23 -
 24
24 -
 25
25 -
 26
26 -
 27
27 -
 28
28 -
 29
29 -
 30
30 -
 31
31 -
 32
32 -
 33
33 -
 34
34 -
 35
35 -
 36
36 -
 37
37 -
 38
38 -
 39
39 -
 40
40 -
 41
41 -
 42
42 -
 43
43 -
 44
44 -
 45
45 -
 46
46 -
 47
47 -
 48
48 -
 49
49 -
 50
50 -
 51
51 -
 52
52 -
 53
53 -
 54
54 -
 55
55 -
 56
56 -
 57
57 -
 58
58 -
 59
59 -
 60
60 -
 61
61 -
 62
62 -
 63
63 -
 64
64 -
 65
65 -
 66
66 -
 67
67 -
 68
68 -
 69
69 -
 70
70 -
 71
71 -
 72
72 -
 73
73 -
 74
74 -
 75
75 -
 76
76 -
 77
77 -
 78
78 -
 79
79 -
 80
80 -
 81
81 -
 82
82 -
 83
83 -
 84
84 -
 85
85 -
 86
86 -
 87
87 -
 88
88 -
 89
89 -
 90
90 -
 91
91 -
 92
92 -
 93
93 -
 94
94 -
 95
95 -
 96
96 -
 97
97 -
 98
98 -
 99
99 -
 100
100 -
 101
101 -
 102
102 -
 103
103 -
 104
104 -
 105
105 -
 106
106 -
 107
107 -
 108
108 -
 109
109 -
 110
110 -
 111
111 -
 112
112 -
 113
113 -
 114
114 -
 115
115 -
 116
116 -
 117
117 -
 118
118 -
 119
119 -
 120
120 -
 121
121 -
 122
122 -
 123
123 -
 124
124 -
 125
125 -
 126
126 -
 127
127 -
 128
128 -
 129
129 -
 130
130 -
 131
131 -
 132
132 -
 133
133 -
 134
134 -
 135
135 -
 136
136 -
 137
137 -
 138
138 -
 139
139 -
 140
140 -
 141
141 -
 142
142 -
 143
143 -
 144
144 -
 145
145 -
 146
146 -
 147
147 -
 148
148 -
 149
149 -
 150
150 -
 151
151 -
 152
152 -
 153
153 -
 154
154 -
 155
155 -
 156
156 -
 157
157 -
 158
158 -
 159
159 -
 160
160 -
 161
161 -
 162
162 -
 163
163 -
 164
164 -
 165
165 -
 166
166 -
 167
167 -
 168
168 -
 169
169 -
 170
170 -
 171
171 -
 172
172 -
 173
173 -
 174
174 -
 175
175 -
 176
176 -
 177
177 -
 178
178 -
 179
179 -
 180
180 -
 181
181 -
 182
182 -
 183
183 -
 184
184 -
 185
185 -
 186
186 -
 187
187 -
 188
188 -
 189
189 -
 190
190 -
 191
191 -
 192
192 -
 193
193 -
 194
194 -
 195
195 -
 196
196 -
 197
197 -
 198
198 -
 199
199 -
 200
200 -
 201
201 -
 202
202 -
 203
203 -
 204
204 -
 205
205 -
 206
206 -
 207
207 -
 208
208 -
 209
209 -
 210
210 -
 211
211 -
 212
212 -
 213
213 -
 214
214 -
 215
215 -
 216
216 -
 217
217 -
 218
218 -
 219
219 -
 220
220 -
 221
221 -
 222
222 -
 223
223 -
 224
224 -
 225
225 -
 226
226 -
 227
227 -
 228
228 -
 229
229 -
 230
230 -
 231
231 -
 232
232 -
 233
233 -
 234
234 -
 235
235 -
 236
236 -
 237
237 -
 238
238 -
 239
239 -
 240
240 -
 241
241 -
 242
242 -
 243
243 -
 244
244 -
 245
245 -
 246
246 -
 247
247 -
 248
248 -
 249
249 -
 250
250 -
 251
251 -
 252
252 -
 253
253 -
 254
254 -
 255
255 -
 256
256 -
 257
257 -
 258
258 -
 259
259 -
 260
260 -
 261
261 -
 262
262 -
 263
263 -
 264
264 -
 265
265 -
 266
266 -
 267
267 -
 268
268 -
 269
269 -
 270
270 -
 271
271 -
 272
272 -
 273
273 -
 274
274 -
 275
275 -
 276
276 -
 277
277 -
 278
278 -
 279
279 -
 280
280 -
 281
281 -
 282
282 -
 283
283 -
 284
284 -
 285
285 -
 286
286 -
 287
287 -
 288
288 -
 289
289 -
 290
290 -
 291
291 -
 292
292 -
 293
293 -
 294
294 -
 295
295 -
 296
296 -
 297
297 -
 298
298 -
 299
299 -
 300
300 -
 301
301 -
 302
302 -
 303
303 -
 304
304 -
 305
305 -
 306
306 -
 307
307 -
 308
308 -
 309
309 -
 310
310 -
 311
311 -
 312
312 -
 313
313 -
 314
314 -
 315
315 -
 316
316 -
 317
317 -
 318
318 -
 319
319 -
 320
320 -
 321
321 -
 322
322 -
 323
323 -
 324
324 -
 325
325 -
 326
326 -
 327
327 -
 328
328 -
 329
329 -
 330
330 -
 331
331 -
 332
332
 |
 |

75
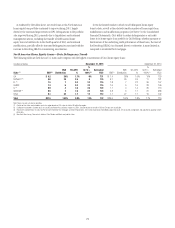
Consumer Loan Net Credit Losses and Ratios
Average
loans (1) Net credit losses (2)(3)
In millions of dollars, except average loan amounts in billions 2015 2015 2014 2013
Citicorp
Total $281.3 $6,029 $ 6,860 $ 7,017
Ratio 2.14% 2.36% 2.52%
Retail banking
Total $148.1 $1,241 $ 1,366 $ 1,274
Ratio 0.84% 0.90% 0.89%
North America 49.5 152 143 186
Ratio 0.31% 0.31% 0.44%
Latin America 25.0 764 907 816
Ratio 3.06% 3.20% 2.90%
Asia (4) 73.6 325 316 272
Ratio 0.44% 0.41% 0.38%
Cards
Total $133.2 $4,788 $ 5,494 $ 5,743
Ratio 3.59% 3.96% 4.26%
North America—Citi-branded 64.0 1,892 2,197 2,555
Ratio 2.96% 3.31% 3.72%
North America—Retail services 43.4 1,709 1,866 1,895
Ratio 3.94% 4.32% 4.92%
Latin America 8.2 785 954 794
Ratio 9.57% 9.54% 9.57%
Asia (4) 17.6 402 477 499
Ratio 2.28% 2.51% 2.57%
Citi Holdings (3)
Total $ 61.6 $1,035 $ 1,819 $ 3,239
Ratio 1.68% 2.01% 2.98%
International 5.0 173 261 411
Ratio 3.46% 2.21% 2.91%
North America 56.6 862 1,558 2,828
Ratio 1.52% 1.97% 2.99%
Other (5) — 4 6 6
Total Citigroup $342.9 $7,068 $ 8,685 $10,262
Ratio 2.06% 2.28% 2.64%
(1) Average loans include interest and fees on credit cards.
(2) The ratios of net credit losses are calculated based on average loans, net of unearned income.
(3) As a result of the entry into an agreement to sell OneMain Financial (OneMain), OneMain was classified as held-for-sale (HFS) beginning March 31, 2015. As a result of HFS accounting treatment, approximately
$350 million of net credit losses (NCLs) were recorded as a reduction in revenue (Other revenue) during 2015. Accordingly, these NCLs are not included in this table. Loans HFS are excluded from this table as they
are recorded in Other assets.
(4) For reporting purposes, Asia GCB includes the results of operations of EMEA GCB for all periods presented.
(5) Represents NCLs on loans classified as Consumer loans on the Consolidated Balance Sheet that are not included in the Citi Holdings consumer credit metrics.
