Citibank 2015 Annual Report Download - page 33
Download and view the complete annual report
Please find page 33 of the 2015 Citibank annual report below. You can navigate through the pages in the report by either clicking on the pages listed below, or by using the keyword search tool below to find specific information within the annual report.-
 1
1 -
2
-
3
-
4
-
5
-
6
-
7
-
8
-
9
-
10
-
11
-
12
-
13
-
14
-
15
-
16
-
17
-
18
-
19
-
20
-
21
-
22
-
 23
23 -
 24
24 -
 25
25 -
 26
26 -
 27
27 -
 28
28 -
 29
29 -
 30
30 -
 31
31 -
 32
32 -
 33
33 -
 34
34 -
 35
35 -
 36
36 -
 37
37 -
 38
38 -
 39
39 -
 40
40 -
 41
41 -
 42
42 -
 43
43 -
44
-
45
-
46
-
47
-
48
-
49
-
50
-
51
-
52
-
53
-
54
-
55
-
56
-
57
-
58
-
59
-
60
-
61
-
62
-
63
-
64
-
65
-
66
-
67
-
68
-
69
-
70
-
71
-
72
-
73
-
74
-
75
-
76
-
77
-
78
-
79
-
80
-
81
-
82
-
83
-
84
-
85
-
86
-
87
-
88
-
89
-
90
-
91
-
92
-
93
-
94
-
95
-
96
-
97
-
98
-
99
-
100
-
101
-
102
-
103
-
104
-
105
-
106
-
107
-
108
-
109
-
110
-
111
-
112
-
113
-
114
-
115
-
116
-
117
-
118
-
119
-
120
-
121
-
122
-
123
-
124
-
125
-
126
-
127
-
128
-
129
-
130
-
131
-
132
-
133
-
134
-
135
-
136
-
137
-
138
-
139
-
140
-
141
-
142
-
143
-
144
-
145
-
146
-
147
-
148
-
149
-
150
-
151
-
152
-
153
-
154
-
155
-
156
-
157
-
158
-
159
-
160
-
161
-
162
-
163
-
164
-
165
-
166
-
167
-
168
-
169
-
170
-
171
-
172
-
173
-
174
-
175
-
176
-
177
-
178
-
179
-
180
-
181
-
182
-
183
-
184
-
185
-
186
-
187
-
188
-
189
-
190
-
191
-
192
-
193
-
194
-
195
-
196
-
197
-
198
-
199
-
200
-
201
-
202
-
203
-
204
-
205
-
206
-
207
-
208
-
209
-
210
-
211
-
212
-
213
-
214
-
215
-
216
-
217
-
218
-
219
-
220
-
221
-
222
-
223
-
224
-
225
-
226
-
227
-
228
-
229
-
230
-
231
-
232
-
233
-
234
-
235
-
236
-
237
-
238
-
239
-
240
-
241
-
242
-
243
-
244
-
245
-
246
-
247
-
248
-
249
-
250
-
251
-
252
-
253
-
254
-
255
-
256
-
257
-
258
-
259
-
260
-
261
-
262
-
263
-
264
-
265
-
266
-
267
-
268
-
269
-
270
-
271
-
272
-
273
-
274
-
275
-
276
-
277
-
278
-
279
-
280
-
281
-
282
-
283
-
284
-
285
-
286
-
287
-
288
-
289
-
290
-
291
-
292
-
293
-
294
-
295
-
296
-
297
-
298
-
299
-
300
-
301
-
302
-
303
-
304
-
305
-
306
-
307
-
308
-
309
-
310
-
311
-
312
-
313
-
314
-
315
-
316
-
317
-
318
-
319
-
320
-
321
-
322
-
323
-
324
-
325
-
326
-
327
-
328
-
329
-
330
-
331
-
332
 |
 |

15
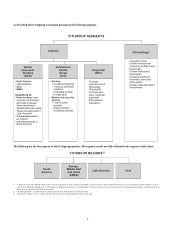
CITICORP
Citicorp is Citigroup’s global bank for consumers and businesses and represents Citi’s core franchises. Citicorp is focused on providing best-in-class products and
services to customers and leveraging Citigroup’s unparalleled global network, including many of the world’s emerging economies. Citicorp is physically present
in approximately 100 countries, many for over 100 years, and offers services in over 160 countries and jurisdictions. Citi believes this global network provides
a strong foundation for servicing the broad financial services needs of its large multinational clients and for meeting the needs of retail, private banking,
commercial, public sector and institutional clients around the world.
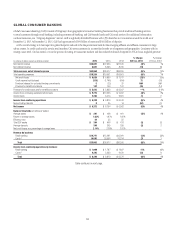
Citicorp consists of the following operating businesses: Global Consumer Banking (which consists of consumer banking businesses in North America,
EMEA, Latin America and Asia) and Institutional Clients Group (which includes Banking and Markets and securities services). Citicorp also includes
Corporate/Other. At December 31, 2015, Citicorp had approximately $1.7 trillion of assets and $901 billion of deposits, representing approximately 96% of Citi’s
total assets and 99% of Citi’s total deposits.
Consistent with its strategy to continue to efficiently allocate its resources and further simplify its Global Consumer Bank, in February 2016, Citi announced
that it intends to exit its consumer businesses in Argentina, Brazil and Colombia. These consumer businesses, consisting of approximately $6 billion of assets, $5
billion of consumer loans and $3 billion of deposits as of December 31, 2015, contributed approximately $1.1 billion of revenues, $900 million of expenses and
a net loss of $34 million in 2015. These businesses, which previously have been reported as part of Latin America GCB, will be reported as part of Citi Holdings
beginning in the first quarter of 2016. See also “Citigroup Segments” above and “Citi Holdings” below. While Citi does not intend to exit its consumer businesses
in Venezuela, these businesses are not significant, lending predominantly to support ICG activities, and will be reported as part of ICG beginning in the first
quarter of 2016. Similarly, Citi’s remaining indirect investment in Banco de Chile will be reported as part of ICG beginning in the first quarter of 2016.
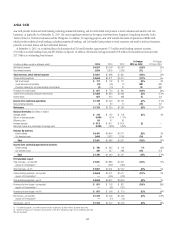
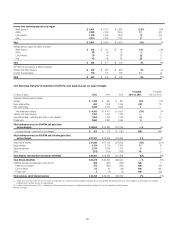
In millions of dollars except as otherwise noted 2015 2014 2013
% Change
2015 vs. 2014
% Change
2014 vs. 2013
Net interest revenue $ 42,926 $ 43,402 $ 42,445 (1)% 2%
Non-interest revenue 25,591 25,968 27,504 (1) (6)
Total revenues, net of interest expense $ 68,517 $ 69,370 $ 69,949 (1)% (1)%
Provisions for credit losses and for benefits and claims
Net credit losses $ 6,236 $ 7,136 $ 7,199 (13)% (1)%
Credit reserve build (release) 309 (1,238) (811) NM (53)
Provision for loan losses $ 6,545 $ 5,898 $ 6,388 11% (8)%
Provision for benefits and claims 107 144 167 (26) (14)
Provision for unfunded lending commitments 100 (152)90 NM NM
Total provisions for credit losses and for benefits and claims $ 6,752 $ 5,890 $ 6,645 15% (11)%
Total operating expenses $ 39,000 $ 45,362 $ 40,498 (14)% 12%
Income from continuing operations before taxes $ 22,765 $ 18,118 $ 22,806 26% (21)%
Income taxes 6,437 7,140 7,319 (10) (2)
Income from continuing operations $ 16,328 $ 10,978 $ 15,487 49% (29)%
Income (loss) from discontinued operations, net of taxes (54) (2)270 NM NM
Noncontrolling interests 79 186 211 (58) (12)
Net income $ 16,195 $ 10,790 $ 15,546 50% (31)%
Balance sheet data (in billions of dollars)
Total end-of-period (EOP) assets $ 1,657 $ 1,713 $ 1,726 (3)% (1)%
Average assets 1,712 1,753 1,711 (2)2
Return on average assets 0.95% 0.62% 0.91%
Efficiency ratio 57 65 58
Total EOP loans $ 573 $ 565 $ 565 1—
Total EOP deposits 901 883 900 2(2)
NM Not meaningful