Citibank 2015 Annual Report Download - page 62
Download and view the complete annual report
Please find page 62 of the 2015 Citibank annual report below. You can navigate through the pages in the report by either clicking on the pages listed below, or by using the keyword search tool below to find specific information within the annual report.-
 1
1 -
2
-
3
-
4
-
5
-
6
-
7
-
8
-
9
-
10
-
11
-
12
-
13
-
14
-
15
-
16
-
17
-
18
-
19
-
20
-
21
-
22
-
23
-
24
-
25
-
26
-
27
-
28
-
29
-
30
-
31
-
32
-
33
-
34
-
35
-
36
-
37
-
38
-
39
-
40
-
41
-
42
-
43
-
44
-
45
-
46
-
47
-
48
-
49
-
50
-
51
-
 52
52 -
 53
53 -
 54
54 -
 55
55 -
 56
56 -
 57
57 -
 58
58 -
 59
59 -
 60
60 -
 61
61 -
 62
62 -
 63
63 -
 64
64 -
 65
65 -
 66
66 -
 67
67 -
 68
68 -
 69
69 -
 70
70 -
 71
71 -
 72
72 -
73
-
74
-
75
-
76
-
77
-
78
-
79
-
80
-
81
-
82
-
83
-
84
-
85
-
86
-
87
-
88
-
89
-
90
-
91
-
92
-
93
-
94
-
95
-
96
-
97
-
98
-
99
-
100
-
101
-
102
-
103
-
104
-
105
-
106
-
107
-
108
-
109
-
110
-
111
-
112
-
113
-
114
-
115
-
116
-
117
-
118
-
119
-
120
-
121
-
122
-
123
-
124
-
125
-
126
-
127
-
128
-
129
-
130
-
131
-
132
-
133
-
134
-
135
-
136
-
137
-
138
-
139
-
140
-
141
-
142
-
143
-
144
-
145
-
146
-
147
-
148
-
149
-
150
-
151
-
152
-
153
-
154
-
155
-
156
-
157
-
158
-
159
-
160
-
161
-
162
-
163
-
164
-
165
-
166
-
167
-
168
-
169
-
170
-
171
-
172
-
173
-
174
-
175
-
176
-
177
-
178
-
179
-
180
-
181
-
182
-
183
-
184
-
185
-
186
-
187
-
188
-
189
-
190
-
191
-
192
-
193
-
194
-
195
-
196
-
197
-
198
-
199
-
200
-
201
-
202
-
203
-
204
-
205
-
206
-
207
-
208
-
209
-
210
-
211
-
212
-
213
-
214
-
215
-
216
-
217
-
218
-
219
-
220
-
221
-
222
-
223
-
224
-
225
-
226
-
227
-
228
-
229
-
230
-
231
-
232
-
233
-
234
-
235
-
236
-
237
-
238
-
239
-
240
-
241
-
242
-
243
-
244
-
245
-
246
-
247
-
248
-
249
-
250
-
251
-
252
-
253
-
254
-
255
-
256
-
257
-
258
-
259
-
260
-
261
-
262
-
263
-
264
-
265
-
266
-
267
-
268
-
269
-
270
-
271
-
272
-
273
-
274
-
275
-
276
-
277
-
278
-
279
-
280
-
281
-
282
-
283
-
284
-
285
-
286
-
287
-
288
-
289
-
290
-
291
-
292
-
293
-
294
-
295
-
296
-
297
-
298
-
299
-
300
-
301
-
302
-
303
-
304
-
305
-
306
-
307
-
308
-
309
-
310
-
311
-
312
-
313
-
314
-
315
-
316
-
317
-
318
-
319
-
320
-
321
-
322
-
323
-
324
-
325
-
326
-
327
-
328
-
329
-
330
-
331
-
332
 |
 |

44
Basel III (Full Implementation)
Citigroup’s Capital Resources Under Basel III
(Full Implementation)
Citi currently estimates that its effective minimum Common Equity Tier 1
Capital, Tier 1 Capital and Total Capital ratio requirements under the U.S.
Basel III rules, on a fully implemented basis and assuming a 3% GSIB
surcharge, may be 10%, 11.5% and 13.5%, respectively.
Further, under the U.S. Basel III rules, Citi must also comply with a 4%
minimum Tier 1 Leverage ratio requirement and an effective 5% minimum
Supplementary Leverage ratio requirement.
The following tables set forth the capital tiers, total risk-weighted assets,
risk-based capital ratios, quarterly adjusted average total assets, Total
Leverage Exposure and leverage ratios, assuming full implementation
under the U.S. Basel III rules, for Citi as of December 31, 2015 and
December 31, 2014.
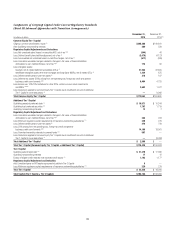
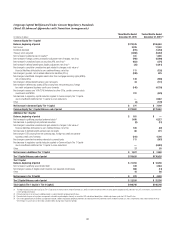
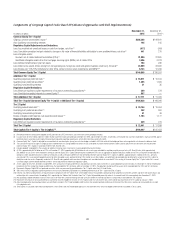
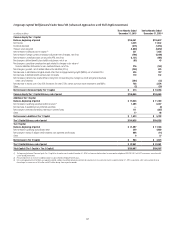
Citigroup Capital Components and Ratios Under Basel III (Full Implementation)
December 31, 2015 December 31, 2014 (1)
In millions of dollars, except ratios
Advanced
Approaches
Standardized
Approach
Advanced
Approaches
Standardized
Approach
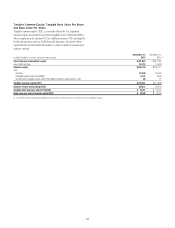
Common Equity Tier 1 Capital $ 146,865 $ 146,865 $ 136,597 $ 136,597
Tier 1 Capital 164,036 164,036 148,066 148,066
Total Capital (Tier 1 Capital + Tier 2 Capital) (2) 186,097 198,655 165,454 178,413
Total Risk-Weighted Assets 1,216,277 1,162,884 1,292,605 1,228,488
Common Equity Tier 1 Capital ratio (3)(4) 12.07% 12.63% 10.57% 11.12%
Tier 1 Capital ratio (3)(4) 13.49 14.11 11.45 12.05
Total Capital ratio (3)(4) 15.30 17.08 12.80 14.52
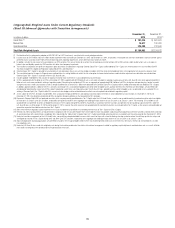
In millions of dollars, except ratios December 31, 2015 December 31, 2014 (1)
Quarterly Adjusted Average Total Assets (5) $1,724,710 $1,835,637
Total Leverage Exposure (6) 2,317,849 2,492,636
Tier 1 Leverage ratio (4) 9.51% 8.07%
Supplementary Leverage ratio (4) 7.08 5.94
(1) Restated to reflect the retrospective adoption of ASU 2014-01 for LIHTC investments, consistent with current period presentation.
(2) Under the Advanced Approaches framework eligible credit reserves that exceed expected credit losses are eligible for inclusion in Tier 2 Capital to the extent the excess reserves do not exceed 0.6% of credit risk-
weighted assets, which differs from the Standardized Approach in which the allowance for credit losses is eligible for inclusion in Tier 2 Capital up to 1.25% of credit risk-weighted assets, with any excess allowance for
credit losses being deducted in arriving at credit risk-weighted assets.
(3) As of December 31, 2015 and December 31, 2014, Citi’s Common Equity Tier 1 Capital, Tier 1 Capital, and Total Capital ratios were the lower derived under the Basel III Advanced Approaches framework.
(4) Citi’s Basel III capital ratios and related components, on a fully implemented basis, are non-GAAP financial measures. Citi believes these ratios and the related components provide useful information to investors and
others by measuring Citi’s progress against future regulatory capital standards.
(5) Tier 1 Leverage ratio denominator.
(6) Supplementary Leverage ratio denominator.