Citibank 2015 Annual Report Download - page 68
Download and view the complete annual report
Please find page 68 of the 2015 Citibank annual report below. You can navigate through the pages in the report by either clicking on the pages listed below, or by using the keyword search tool below to find specific information within the annual report.-
 1
1 -
2
-
3
-
4
-
5
-
6
-
7
-
8
-
9
-
10
-
11
-
12
-
13
-
14
-
15
-
16
-
17
-
18
-
19
-
20
-
21
-
22
-
23
-
24
-
25
-
26
-
27
-
28
-
29
-
30
-
31
-
32
-
33
-
34
-
35
-
36
-
37
-
38
-
39
-
40
-
41
-
42
-
43
-
44
-
45
-
46
-
47
-
48
-
49
-
50
-
51
-
52
-
53
-
54
-
55
-
56
-
57
-
 58
58 -
 59
59 -
 60
60 -
 61
61 -
 62
62 -
 63
63 -
 64
64 -
 65
65 -
 66
66 -
 67
67 -
 68
68 -
 69
69 -
 70
70 -
 71
71 -
 72
72 -
 73
73 -
 74
74 -
 75
75 -
 76
76 -
 77
77 -
 78
78 -
79
-
80
-
81
-
82
-
83
-
84
-
85
-
86
-
87
-
88
-
89
-
90
-
91
-
92
-
93
-
94
-
95
-
96
-
97
-
98
-
99
-
100
-
101
-
102
-
103
-
104
-
105
-
106
-
107
-
108
-
109
-
110
-
111
-
112
-
113
-
114
-
115
-
116
-
117
-
118
-
119
-
120
-
121
-
122
-
123
-
124
-
125
-
126
-
127
-
128
-
129
-
130
-
131
-
132
-
133
-
134
-
135
-
136
-
137
-
138
-
139
-
140
-
141
-
142
-
143
-
144
-
145
-
146
-
147
-
148
-
149
-
150
-
151
-
152
-
153
-
154
-
155
-
156
-
157
-
158
-
159
-
160
-
161
-
162
-
163
-
164
-
165
-
166
-
167
-
168
-
169
-
170
-
171
-
172
-
173
-
174
-
175
-
176
-
177
-
178
-
179
-
180
-
181
-
182
-
183
-
184
-
185
-
186
-
187
-
188
-
189
-
190
-
191
-
192
-
193
-
194
-
195
-
196
-
197
-
198
-
199
-
200
-
201
-
202
-
203
-
204
-
205
-
206
-
207
-
208
-
209
-
210
-
211
-
212
-
213
-
214
-
215
-
216
-
217
-
218
-
219
-
220
-
221
-
222
-
223
-
224
-
225
-
226
-
227
-
228
-
229
-
230
-
231
-
232
-
233
-
234
-
235
-
236
-
237
-
238
-
239
-
240
-
241
-
242
-
243
-
244
-
245
-
246
-
247
-
248
-
249
-
250
-
251
-
252
-
253
-
254
-
255
-
256
-
257
-
258
-
259
-
260
-
261
-
262
-
263
-
264
-
265
-
266
-
267
-
268
-
269
-
270
-
271
-
272
-
273
-
274
-
275
-
276
-
277
-
278
-
279
-
280
-
281
-
282
-
283
-
284
-
285
-
286
-
287
-
288
-
289
-
290
-
291
-
292
-
293
-
294
-
295
-
296
-
297
-
298
-
299
-
300
-
301
-
302
-
303
-
304
-
305
-
306
-
307
-
308
-
309
-
310
-
311
-
312
-
313
-
314
-
315
-
316
-
317
-
318
-
319
-
320
-
321
-
322
-
323
-
324
-
325
-
326
-
327
-
328
-
329
-
330
-
331
-
332
 |
 |

50
Supplementary Leverage Ratio
Citigroup’s Supplementary Leverage ratio was 7.08% for the fourth quarter
of 2015, compared to 6.85% for the third quarter of 2015 and 5.94% for
the fourth quarter of 2014. The growth in the ratio quarter-over-quarter
was principally driven by an increase in Tier 1 Capital attributable largely
to net income of $3.3 billion and a $1.5 billion noncumulative perpetual
preferred stock issuance, as well as an overall reduction in Total Leverage
Exposure resulting from reduced on-balance sheet assets and derivative
exposures, partially offset by a $1.8 billion return of capital to common
shareholders in the form of share repurchases and dividends. The growth in
the ratio from the fourth quarter of 2014 was also principally driven by an
increase in Tier 1 Capital attributable largely to net income of $17.2 billion
and approximately $6.2 billion (net of issuance costs) of noncumulative
perpetual preferred stock issuances, offset in part by the return of capital to
common shareholders. Further, a decrease in Total Leverage Exposure also
contributed to the growth in the ratio from the fourth quarter of 2014.
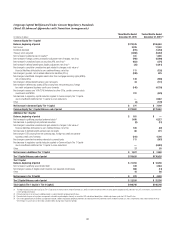
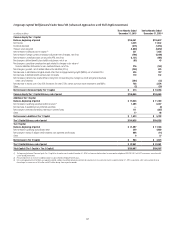
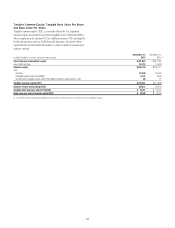
The following table sets forth Citi’s Supplementary Leverage ratio
and related components, assuming full implementation under the U.S.
Basel III rules, for the three months ended December 31, 2015 and
December 31, 2014.
Citigroup Basel III Supplementary Leverage Ratio and Related Components (Full Implementation)
In millions of dollars, except ratios
December 31,
2015
December 31,
2014 (1)
Tier 1 Capital $ 164,036 $ 148,066
Total Leverage Exposure (TLE)
On-balance sheet assets (2) $1,784,248 $1,899,955
Certain off-balance sheet exposures: (3)
Potential future exposure (PFE) on derivative contracts 206,128 240,712
Effective notional of sold credit derivatives, net (4) 76,923 96,869
Counterparty credit risk for repo-style transactions (5) 25,939 28,073
Unconditionally cancellable commitments 58,699 61,673
Other off-balance sheet exposures 225,450 229,672
Total of certain off-balance sheet exposures $ 593,139 $ 656,999
Less: Tier 1 Capital deductions 59,538 64,318
Total Leverage Exposure $2,317,849 $2,492,636
Supplementary Leverage ratio 7.08% 5.94%
(1) Restated to reflect the retrospective adoption of ASU 2014-01 for LIHTC investments, consistent with current period presentation.
(2) Represents the daily average of on-balance sheet assets for the quarter.
(3) Represents the average of certain off-balance sheet exposures calculated as of the last day of each month in the quarter.
(4) Under the U.S. Basel III rules, banking organizations are required to include in TLE the effective notional amount of sold credit derivatives, with netting of exposures permitted if certain conditions are met.
(5) Repo-style transactions include repurchase or reverse repurchase transactions and securities borrowing or securities lending transactions.
Citibank’s Supplementary Leverage ratio, assuming full implementation
under the U.S. Basel III rules, was 6.65% for the fourth quarter of 2015,
compared to 6.67% for the third quarter of 2015 and 6.20% for the fourth
quarter of 2014. The ratio remained substantially unchanged from the third
quarter of 2015 as the growth in Tier 1 Capital resulting primarily from
quarterly net income and a $2.1 billion noncumulative perpetual preferred
stock issuance was offset by cash dividends paid by Citibank to its parent,
Citicorp, and which were subsequently remitted to Citigroup. The increase
in the ratio from the fourth quarter of 2014 was principally driven by net
income and DTA utilization, as well as an overall reduction in Total Leverage
Exposure, partially offset by cash dividends paid by Citibank to its parent,
Citicorp, and which were subsequently remitted to Citigroup.