Citibank 2015 Annual Report Download - page 278
Download and view the complete annual report
Please find page 278 of the 2015 Citibank annual report below. You can navigate through the pages in the report by either clicking on the pages listed below, or by using the keyword search tool below to find specific information within the annual report.-
 1
1 -
2
-
3
-
4
-
5
-
6
-
7
-
8
-
9
-
10
-
11
-
12
-
13
-
14
-
15
-
16
-
17
-
18
-
19
-
20
-
21
-
22
-
23
-
24
-
25
-
26
-
27
-
28
-
29
-
30
-
31
-
32
-
33
-
34
-
35
-
36
-
37
-
38
-
39
-
40
-
41
-
42
-
43
-
44
-
45
-
46
-
47
-
48
-
49
-
50
-
51
-
52
-
53
-
54
-
55
-
56
-
57
-
58
-
59
-
60
-
61
-
62
-
63
-
64
-
65
-
66
-
67
-
68
-
69
-
70
-
71
-
72
-
73
-
74
-
75
-
76
-
77
-
78
-
79
-
80
-
81
-
82
-
83
-
84
-
85
-
86
-
87
-
88
-
89
-
90
-
91
-
92
-
93
-
94
-
95
-
96
-
97
-
98
-
99
-
100
-
101
-
102
-
103
-
104
-
105
-
106
-
107
-
108
-
109
-
110
-
111
-
112
-
113
-
114
-
115
-
116
-
117
-
118
-
119
-
120
-
121
-
122
-
123
-
124
-
125
-
126
-
127
-
128
-
129
-
130
-
131
-
132
-
133
-
134
-
135
-
136
-
137
-
138
-
139
-
140
-
141
-
142
-
143
-
144
-
145
-
146
-
147
-
148
-
149
-
150
-
151
-
152
-
153
-
154
-
155
-
156
-
157
-
158
-
159
-
160
-
161
-
162
-
163
-
164
-
165
-
166
-
167
-
168
-
169
-
170
-
171
-
172
-
173
-
174
-
175
-
176
-
177
-
178
-
179
-
180
-
181
-
182
-
183
-
184
-
185
-
186
-
187
-
188
-
189
-
190
-
191
-
192
-
193
-
194
-
195
-
196
-
197
-
198
-
199
-
200
-
201
-
202
-
203
-
204
-
205
-
206
-
207
-
208
-
209
-
210
-
211
-
212
-
213
-
214
-
215
-
216
-
217
-
218
-
219
-
220
-
221
-
222
-
223
-
224
-
225
-
226
-
227
-
228
-
229
-
230
-
231
-
232
-
233
-
234
-
235
-
236
-
237
-
238
-
239
-
240
-
241
-
242
-
243
-
244
-
245
-
246
-
247
-
248
-
249
-
250
-
251
-
252
-
253
-
254
-
255
-
256
-
257
-
258
-
259
-
260
-
261
-
262
-
263
-
264
-
265
-
266
-
267
-
 268
268 -
 269
269 -
 270
270 -
 271
271 -
 272
272 -
 273
273 -
 274
274 -
 275
275 -
 276
276 -
 277
277 -
 278
278 -
 279
279 -
 280
280 -
 281
281 -
 282
282 -
 283
283 -
 284
284 -
 285
285 -
 286
286 -
 287
287 -
 288
288 -
289
-
290
-
291
-
292
-
293
-
294
-
295
-
296
-
297
-
298
-
299
-
300
-
301
-
302
-
303
-
304
-
305
-
306
-
307
-
308
-
309
-
310
-
311
-
312
-
313
-
314
-
315
-
316
-
317
-
318
-
319
-
320
-
321
-
322
-
323
-
324
-
325
-
326
-
327
-
328
-
329
-
330
-
331
-
332
 |
 |

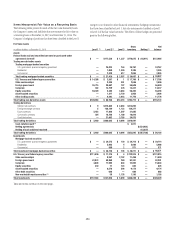
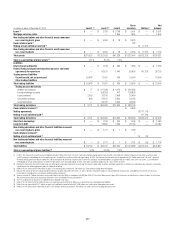
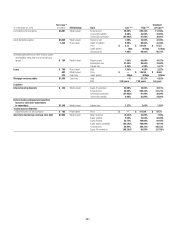
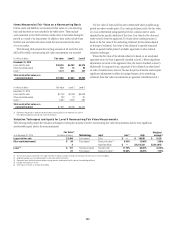
260
In millions of dollars
Dec. 31,
2013
Net realized/unrealized
gains (losses) incl. in Transfers
Purchases Issuances Sales Settlements
Dec. 31,
2014
Unrealized
gains
(losses)
still held (3)
Principal
transactions Other (1)(2)
into
Level 3
out of
Level 3
Assets
Federal funds sold and securities
borrowed or purchased under
agreements to resell $ 3,566 $ (61) $ — $ 84 $ (8) $ 75 $— $ — $ (258) $ 3,398 $ 133
Trading non-derivative assets
Trading mortgage-
backed securities
U.S. government-sponsored
agency guaranteed 1,094 117 — 854 (966) 714 26 (695) (59) 1,085 8
Residential 2,854 457 — 442 (514) 2,582 — (3,141) — 2,680 132
Commercial 256 17 — 187 (376) 758 — (402) — 440 (4)
Total trading mortgage-backed
securities $ 4,204 $ 591 $ — $ 1,483 $(1,856) $ 4,054 $26 $ (4,238) $ (59) $ 4,205 $ 136
U.S. Treasury and federal agency
securities $ — $ 3 $ — $ — $ — $ 7 $— $ (10) $ — $ — $ —
State and municipal 222 10 — 150 (105) 34 — (70) — 241 1
Foreign government 416 (56) — 130 (253) 676 — (707) — 206 5
Corporate 1,835 (127) — 465 (502) 1,988 — (2,839) — 820 (139)
Equity securities 1,057 87 — 142 (209) 1,437 — (295) — 2,219 337
Asset-backed securities 4,342 876 — 158 (332) 3,893 — (5,643) — 3,294 3
Other trading assets 3,184 269 — 2,637 (2,278) 5,427 — (4,490) (377 ) 4,372 31
Total trading non-derivative assets $15,260 $ 1,653 $ — $ 5,165 $(5,535) $17,516 $ 26 $(18,292) $ (436) $15,357 $ 374
Trading derivatives, net (4)
Interest rate contracts $ 839 $ (818) $ — $ 24 $ (98) $ 113 $— $ (162) $ (109) $ (211) $ (414)
Foreign exchange contracts 695 92 — 47 (39) 59 — (59) (17) 778 56
Equity contracts (858) 482 — (916 ) 766 435 — (279) (493) (863) (274)
Commodity contracts (1,393) (338) — 92 (12) — — — 29 (1,622) (174)
Credit derivatives (274) (567) — 4 (156) 103 — (3) 150 (743) (369)
Total trading derivatives, net (4) $ (991) $ (1,149) $ — $ (749) $ 461 $ 710 $— $ (503) $ (440) $ (2,661) $(1,175)
Investments
Mortgage-backed securities
U.S. government-sponsored
agency guaranteed $ 187 $ — $ 52 $ 60 $ (203) $ 17 $— $ (73) $ (2) $ 38 $ (8)
Residential 102 — 33 31 (2) 17 — (173) — 8 —
Commercial — — (6) 4 (7) 10 — — — 1 —
Total investment mortgage-
backed securities $ 289 $ — $ 79 $ 95 $ (212) $ 44 $— $ (246) $ (2) $ 47 $ (8)
U.S. Treasury and federal
agency securities $ 8 $ — $ — $ — $ — $ — $— $ (2) $ — $ 6 $ —
State and municipal 1,643 — (64) 811 (584) 923 — (549) — 2,180 49
Foreign government 344 — (27) 286 (105) 851 — (490) (181) 678 (17)
Corporate 285 — (6) 26 (143) 728 — (218) — 672 (4)
Equity securities 815 — 111 19 (19) 10 — (255) — 681 (78)
Asset-backed securities 1,960 — 41 — (47) 95 — (195) (1,305) 549 (18)
Other debt securities 50 — (1) — — 116 — (115) (50) — —
Non-marketable equity securities 2,508 — 211 67 — 416 — (768) (974) 1,460 81
Total investments $ 7,902 $ — $ 344 $ 1,304 $(1,110) $ 3,183 $— $ (2,838) $ (2,512) $ 6,273 $ 5
Table and notes continue on the next page.