Citibank 2015 Annual Report Download - page 220
Download and view the complete annual report
Please find page 220 of the 2015 Citibank annual report below. You can navigate through the pages in the report by either clicking on the pages listed below, or by using the keyword search tool below to find specific information within the annual report.-
 1
1 -
2
-
3
-
4
-
5
-
6
-
7
-
8
-
9
-
10
-
11
-
12
-
13
-
14
-
15
-
16
-
17
-
18
-
19
-
20
-
21
-
22
-
23
-
24
-
25
-
26
-
27
-
28
-
29
-
30
-
31
-
32
-
33
-
34
-
35
-
36
-
37
-
38
-
39
-
40
-
41
-
42
-
43
-
44
-
45
-
46
-
47
-
48
-
49
-
50
-
51
-
52
-
53
-
54
-
55
-
56
-
57
-
58
-
59
-
60
-
61
-
62
-
63
-
64
-
65
-
66
-
67
-
68
-
69
-
70
-
71
-
72
-
73
-
74
-
75
-
76
-
77
-
78
-
79
-
80
-
81
-
82
-
83
-
84
-
85
-
86
-
87
-
88
-
89
-
90
-
91
-
92
-
93
-
94
-
95
-
96
-
97
-
98
-
99
-
100
-
101
-
102
-
103
-
104
-
105
-
106
-
107
-
108
-
109
-
110
-
111
-
112
-
113
-
114
-
115
-
116
-
117
-
118
-
119
-
120
-
121
-
122
-
123
-
124
-
125
-
126
-
127
-
128
-
129
-
130
-
131
-
132
-
133
-
134
-
135
-
136
-
137
-
138
-
139
-
140
-
141
-
142
-
143
-
144
-
145
-
146
-
147
-
148
-
149
-
150
-
151
-
152
-
153
-
154
-
155
-
156
-
157
-
158
-
159
-
160
-
161
-
162
-
163
-
164
-
165
-
166
-
167
-
168
-
169
-
170
-
171
-
172
-
173
-
174
-
175
-
176
-
177
-
178
-
179
-
180
-
181
-
182
-
183
-
184
-
185
-
186
-
187
-
188
-
189
-
190
-
191
-
192
-
193
-
194
-
195
-
196
-
197
-
198
-
199
-
200
-
201
-
202
-
203
-
204
-
205
-
206
-
207
-
208
-
209
-
 210
210 -
 211
211 -
 212
212 -
 213
213 -
 214
214 -
 215
215 -
 216
216 -
 217
217 -
 218
218 -
 219
219 -
 220
220 -
 221
221 -
 222
222 -
 223
223 -
 224
224 -
 225
225 -
 226
226 -
 227
227 -
 228
228 -
 229
229 -
 230
230 -
231
-
232
-
233
-
234
-
235
-
236
-
237
-
238
-
239
-
240
-
241
-
242
-
243
-
244
-
245
-
246
-
247
-
248
-
249
-
250
-
251
-
252
-
253
-
254
-
255
-
256
-
257
-
258
-
259
-
260
-
261
-
262
-
263
-
264
-
265
-
266
-
267
-
268
-
269
-
270
-
271
-
272
-
273
-
274
-
275
-
276
-
277
-
278
-
279
-
280
-
281
-
282
-
283
-
284
-
285
-
286
-
287
-
288
-
289
-
290
-
291
-
292
-
293
-
294
-
295
-
296
-
297
-
298
-
299
-
300
-
301
-
302
-
303
-
304
-
305
-
306
-
307
-
308
-
309
-
310
-
311
-
312
-
313
-
314
-
315
-
316
-
317
-
318
-
319
-
320
-
321
-
322
-
323
-
324
-
325
-
326
-
327
-
328
-
329
-
330
-
331
-
332
 |
 |

202
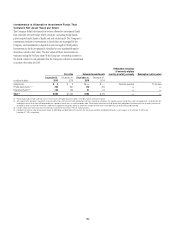
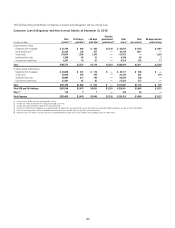
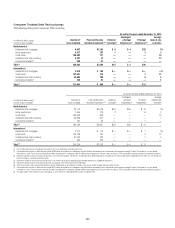
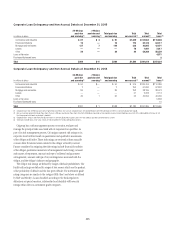
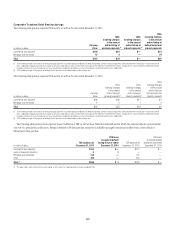
Consumer Troubled Debt Restructurings
The following tables present consumer TDRs occurring:
At and for the year ended December 31, 2015
In millions of dollars except
number of loans modified
Number of
loans modified
Post-modification
recorded investment (1)(2)
Deferred
principal (3)
Contingent
principal
forgiveness (4)
Principal
forgiveness (5)
Average
interest rate
reduction
North America
Residential first mortgages 9,487 $1,282 $ 9 $ 4 $25 1%
Home equity loans 4,317 157 1 — 3 2
Credit cards 188,502 771 — — — 16
Installment and other revolving 4,287 37 — — — 13
Commercial markets (6) 300 47 — — — —
Total (8) 206,893 $2,294 $10 $ 4 $28
International
Residential first mortgages 3,918 $ 104 $— $— $— —%
Credit cards 142,851 374 — — 7 13
Installment and other revolving 65,895 280 — — 5 5
Commercial markets (6) 239 87 — — — 1
Total (8) 212,903 $ 845 $— $— $12
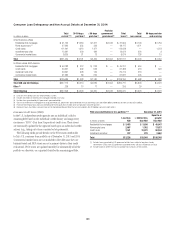
At and for the year ended December 31, 2014
In millions of dollars except
number of loans modified
Number of
loans modified
Post-modification
recorded investment (1)(7)
Deferred
principal (3)
Contingent
principal
forgiveness (4)
Principal
forgiveness (5)
Average
interest rate
reduction
North America
Residential first mortgages 20,114 $2,478 $52 $36 $ 16 1%
Home equity loans 7,444 279 3 — 14 2
Credit cards 185,962 808 — — — 15
Installment and other revolving 46,838 351 — — — 7
Commercial markets (6) 191 35 — — 1 —
Total (8) 260,549 $ 3,951 $55 $ 36 $ 31
International
Residential first mortgages 3,217 $ 114 $— $— $ 1 1%
Credit cards 139,128 447 — — 9 13
Installment and other revolving 61,563 292 — — 7 9
Commercial markets (6) 346 200 — — — —
Total (8) 204,254 $ 1,053 $— $— $ 17
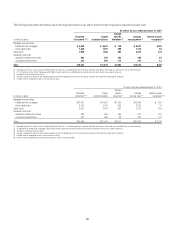
(1) Post-modification balances include past due amounts that are capitalized at the modification date.
(2) Post-modification balances in North America include $209 million of residential first mortgages and $55 million of home equity loans to borrowers who have gone through Chapter 7 bankruptcy in the year ended
December 31, 2015. These amounts include $126 million of residential first mortgages and $47 million of home equity loans that were newly classified as TDRs during 2015, based on previously received OCC guidance.
(3) Represents portion of contractual loan principal that is non-interest bearing but still due from the borrower. Such deferred principal is charged off at the time of permanent modification to the extent that the related loan
balance exceeds the underlying collateral value.
(4) Represents portion of contractual loan principal that is non-interest bearing and, depending upon borrower performance, eligible for forgiveness.
(5) Represents portion of contractual loan principal that was forgiven at the time of permanent modification.
(6) Commercial markets loans are generally borrower-specific modifications and incorporate changes in the amount and/or timing of principal and/or interest.
(7) Post-modification balances in North America include $322 million of residential first mortgages and $80 million of home equity loans to borrowers who have gone through Chapter 7 bankruptcy in the year ended
December 31, 2014. These amounts include $179 million of residential first mortgages and $69 million of home equity loans that were newly classified as TDRs during 2014, based on previously received OCC guidance.
(8) The above tables reflect activity for loans outstanding as of the end of the reporting period that were considered TDRs.