Citibank 2015 Annual Report Download - page 46
Download and view the complete annual report
Please find page 46 of the 2015 Citibank annual report below. You can navigate through the pages in the report by either clicking on the pages listed below, or by using the keyword search tool below to find specific information within the annual report.-
 1
1 -
2
-
3
-
4
-
5
-
6
-
7
-
8
-
9
-
10
-
11
-
12
-
13
-
14
-
15
-
16
-
17
-
18
-
19
-
20
-
21
-
22
-
23
-
24
-
25
-
26
-
27
-
28
-
29
-
30
-
31
-
32
-
33
-
34
-
35
-
 36
36 -
 37
37 -
 38
38 -
 39
39 -
 40
40 -
 41
41 -
 42
42 -
 43
43 -
 44
44 -
 45
45 -
 46
46 -
 47
47 -
 48
48 -
 49
49 -
 50
50 -
 51
51 -
 52
52 -
 53
53 -
 54
54 -
 55
55 -
 56
56 -
57
-
58
-
59
-
60
-
61
-
62
-
63
-
64
-
65
-
66
-
67
-
68
-
69
-
70
-
71
-
72
-
73
-
74
-
75
-
76
-
77
-
78
-
79
-
80
-
81
-
82
-
83
-
84
-
85
-
86
-
87
-
88
-
89
-
90
-
91
-
92
-
93
-
94
-
95
-
96
-
97
-
98
-
99
-
100
-
101
-
102
-
103
-
104
-
105
-
106
-
107
-
108
-
109
-
110
-
111
-
112
-
113
-
114
-
115
-
116
-
117
-
118
-
119
-
120
-
121
-
122
-
123
-
124
-
125
-
126
-
127
-
128
-
129
-
130
-
131
-
132
-
133
-
134
-
135
-
136
-
137
-
138
-
139
-
140
-
141
-
142
-
143
-
144
-
145
-
146
-
147
-
148
-
149
-
150
-
151
-
152
-
153
-
154
-
155
-
156
-
157
-
158
-
159
-
160
-
161
-
162
-
163
-
164
-
165
-
166
-
167
-
168
-
169
-
170
-
171
-
172
-
173
-
174
-
175
-
176
-
177
-
178
-
179
-
180
-
181
-
182
-
183
-
184
-
185
-
186
-
187
-
188
-
189
-
190
-
191
-
192
-
193
-
194
-
195
-
196
-
197
-
198
-
199
-
200
-
201
-
202
-
203
-
204
-
205
-
206
-
207
-
208
-
209
-
210
-
211
-
212
-
213
-
214
-
215
-
216
-
217
-
218
-
219
-
220
-
221
-
222
-
223
-
224
-
225
-
226
-
227
-
228
-
229
-
230
-
231
-
232
-
233
-
234
-
235
-
236
-
237
-
238
-
239
-
240
-
241
-
242
-
243
-
244
-
245
-
246
-
247
-
248
-
249
-
250
-
251
-
252
-
253
-
254
-
255
-
256
-
257
-
258
-
259
-
260
-
261
-
262
-
263
-
264
-
265
-
266
-
267
-
268
-
269
-
270
-
271
-
272
-
273
-
274
-
275
-
276
-
277
-
278
-
279
-
280
-
281
-
282
-
283
-
284
-
285
-
286
-
287
-
288
-
289
-
290
-
291
-
292
-
293
-
294
-
295
-
296
-
297
-
298
-
299
-
300
-
301
-
302
-
303
-
304
-
305
-
306
-
307
-
308
-
309
-
310
-
311
-
312
-
313
-
314
-
315
-
316
-
317
-
318
-
319
-
320
-
321
-
322
-
323
-
324
-
325
-
326
-
327
-
328
-
329
-
330
-
331
-
332
 |
 |

28
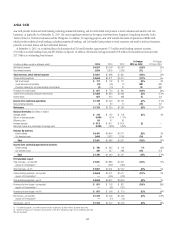
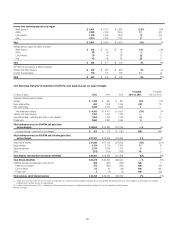
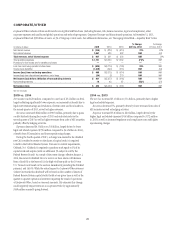
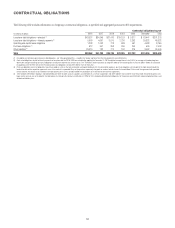
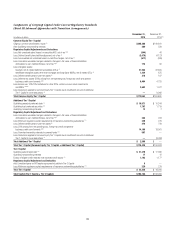
CORPORATE/OTHER
Corporate/Other includes certain unallocated costs of global staff functions (including finance, risk, human resources, legal and compliance), other
corporate expenses and unallocated global operations and technology expenses, Corporate Treasury and discontinued operations. At December 31, 2015,
Corporate/Other had $52 billion of assets, or 3% of Citigroup’s total assets. For additional information, see “Managing Global Risk—Liquidity Risk” below.
In millions of dollars 2015 2014 2013
% Change
2015 vs. 2014
% Change
2014 vs. 2013
Net interest revenue $ (154) $(224) $ (610)31% 63%
Non-interest revenue 1,061 525 932 NM (44)
Total revenues, net of interest expense $ 907 $ 301 $ 322 NM (7)%
Total operating expenses $ 1,751 $ 6,020 $ 1,052 (71)% NM
Provisions for loan losses and for benefits and claims —— — ——
Loss from continuing operations before taxes $ (844) $(5,719) $ (730)85% NM
Income taxes (benefits) (1,339) (344) (216) NM (59)
Income (loss) from continuing operations $ 495 $(5,375) $ (514)NM NM
Income (loss) from discontinued operations, net of taxes (54) (2) 270 NM NM
Net income (loss) before attribution of noncontrolling interests $ 441 $(5,377) $ (244)NM NM
Noncontrolling interests 18 43 87 (58)% (51)
Net income (loss) $ 423 $(5,420) $ (331)NM NM
NM Not meaningful
2015 vs. 2014
Net income was $423 million, compared to a net loss of $5.4 billion in 2014,
largely reflecting significantly lower expenses, an increased tax benefit due to
legal entity restructurings and resolution of certain state and local audits in
the second quarter of 2015, as well as higher revenues.
Revenues increased $606 million to $907 million, primarily due to gains
on debt buybacks during the course of 2015 and real estate sales in the
second quarter of 2015 as well as higher revenues from sales of AFS securities,
partially offset by hedging activities.
Expenses decreased $4.3 billion to $1.8 billion, largely driven by lower
legal and related expenses ($796 million compared to $4.4 billion in 2014),
a benefit from FX translation and lower repositioning charges.
During the fourth quarter of 2015, a change was enacted to the dividend
rate Citi is entitled to receive on the shares of capital stock it is required
to hold in the Federal Reserve System. Pursuant to current requirements,
Citibank, N.A. (Citibank) is required to purchase stock equal to 3% of its
capital stock and surplus (with an additional 3% subject to call by the
Federal Reserve Board). As a result of the recent change, effective January 1,
2016, the statutory dividend Citi is to receive on these shares will decrease
from a fixed 6% to the lesser of (i) the high-yield rate paid on the 10-year
U.S. Treasury note based on the auction immediately preceding the dividend
payment, and (ii) 6%. While the actual impact to Corporate/Other revenues
(where Citi records this dividend) will be based on the number of shares of
Federal Reserve System capital stock it holds at any given time as well as the
quarter-to-quarter operational activities impacting the result of operations
of Corporate/Other, based on year-end amounts, Citi estimates this change
could negatively impact revenues in Corporate/Other by approximately
$160 million annually going forward.
2014 vs. 2013
The net loss increased $5.1 billion to $5.4 billion, primarily due to higher
legal and related expenses.
Revenues decreased 7%, primarily driven by lower revenues from sales of
AFS securities as well as hedging activities.
Expenses increased $5.0 billion to $6.0 billion, largely driven by the
higher legal and related expenses ($4.4 billion compared to $172 million
in 2013) as well as increased regulatory and compliance costs and higher
repositioning charges.