Citibank 2015 Annual Report Download - page 125
Download and view the complete annual report
Please find page 125 of the 2015 Citibank annual report below. You can navigate through the pages in the report by either clicking on the pages listed below, or by using the keyword search tool below to find specific information within the annual report.-
 1
1 -
2
-
3
-
4
-
5
-
6
-
7
-
8
-
9
-
10
-
11
-
12
-
13
-
14
-
15
-
16
-
17
-
18
-
19
-
20
-
21
-
22
-
23
-
24
-
25
-
26
-
27
-
28
-
29
-
30
-
31
-
32
-
33
-
34
-
35
-
36
-
37
-
38
-
39
-
40
-
41
-
42
-
43
-
44
-
45
-
46
-
47
-
48
-
49
-
50
-
51
-
52
-
53
-
54
-
55
-
56
-
57
-
58
-
59
-
60
-
61
-
62
-
63
-
64
-
65
-
66
-
67
-
68
-
69
-
70
-
71
-
72
-
73
-
74
-
75
-
76
-
77
-
78
-
79
-
80
-
81
-
82
-
83
-
84
-
85
-
86
-
87
-
88
-
89
-
90
-
91
-
92
-
93
-
94
-
95
-
96
-
97
-
98
-
99
-
100
-
101
-
102
-
103
-
104
-
105
-
106
-
107
-
108
-
109
-
110
-
111
-
112
-
113
-
114
-
 115
115 -
 116
116 -
 117
117 -
 118
118 -
 119
119 -
 120
120 -
 121
121 -
 122
122 -
 123
123 -
 124
124 -
 125
125 -
 126
126 -
 127
127 -
 128
128 -
 129
129 -
 130
130 -
 131
131 -
 132
132 -
 133
133 -
 134
134 -
 135
135 -
136
-
137
-
138
-
139
-
140
-
141
-
142
-
143
-
144
-
145
-
146
-
147
-
148
-
149
-
150
-
151
-
152
-
153
-
154
-
155
-
156
-
157
-
158
-
159
-
160
-
161
-
162
-
163
-
164
-
165
-
166
-
167
-
168
-
169
-
170
-
171
-
172
-
173
-
174
-
175
-
176
-
177
-
178
-
179
-
180
-
181
-
182
-
183
-
184
-
185
-
186
-
187
-
188
-
189
-
190
-
191
-
192
-
193
-
194
-
195
-
196
-
197
-
198
-
199
-
200
-
201
-
202
-
203
-
204
-
205
-
206
-
207
-
208
-
209
-
210
-
211
-
212
-
213
-
214
-
215
-
216
-
217
-
218
-
219
-
220
-
221
-
222
-
223
-
224
-
225
-
226
-
227
-
228
-
229
-
230
-
231
-
232
-
233
-
234
-
235
-
236
-
237
-
238
-
239
-
240
-
241
-
242
-
243
-
244
-
245
-
246
-
247
-
248
-
249
-
250
-
251
-
252
-
253
-
254
-
255
-
256
-
257
-
258
-
259
-
260
-
261
-
262
-
263
-
264
-
265
-
266
-
267
-
268
-
269
-
270
-
271
-
272
-
273
-
274
-
275
-
276
-
277
-
278
-
279
-
280
-
281
-
282
-
283
-
284
-
285
-
286
-
287
-
288
-
289
-
290
-
291
-
292
-
293
-
294
-
295
-
296
-
297
-
298
-
299
-
300
-
301
-
302
-
303
-
304
-
305
-
306
-
307
-
308
-
309
-
310
-
311
-
312
-
313
-
314
-
315
-
316
-
317
-
318
-
319
-
320
-
321
-
322
-
323
-
324
-
325
-
326
-
327
-
328
-
329
-
330
-
331
-
332
 |
 |

107
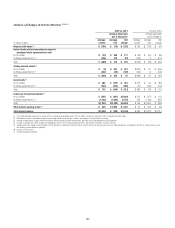
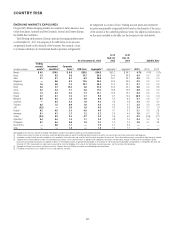
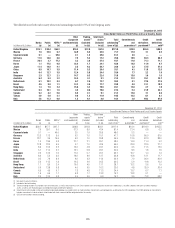
The table below provides the range of market factor VARs associated with Citi’s total trading VAR, inclusive of specific risk:
2015 2014
In millions of dollars Low High Low High
Interest rate $28 $ 84 N/A N/A
Credit spread 56 94 N/A N/A
Fully diversified interest rate and credit spread $65 $127 $84 $158
Foreign exchange 20 54 20 59
Equity 9 35 14 48
Commodity 12 37 11 27
Total trading $70 $140 $84 $163
Total trading and credit portfolio 89 158 96 188
Note: No covariance adjustment can be inferred from the above table as the high and low for each market factor will be from different close of business dates.
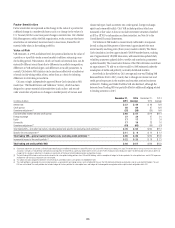
The following table provides the VAR for ICG, excluding the CVA relating to
derivative counterparties, hedges of CVA, fair value option loans and hedges
to the loan portfolio:
In millions of dollars Dec. 31, 2015
Total—all market risk
factors, including general and specific risk $ 71
Average—during year $ 85
High—during year 129
Low—during year 65
VAR Model Review and Validation
Generally, Citi’s VAR review and model validation process entails reviewing
the model framework, major assumptions, and implementation of the
mathematical algorithm. In addition, as part of the model validation
process, product specific back-testing on portfolios is periodically completed
and reviewed with Citi’s U.S. banking regulators. Furthermore, Regulatory
VAR (as described below) back-testing is performed against buy-and-hold
profit and loss on a monthly basis for multiple sub-portfolios across the
organization (trading desk level, ICG business segment and Citigroup) and
the results are shared with the U.S. banking regulators.
Significant VAR model and assumption changes must be independently
validated within Citi’s risk management organization. This validation
process includes a review by Citi’s model validation group and further
approval from its model validation review committee, which is composed
of senior quantitative risk management officers. In the event of significant
model changes, parallel model runs are undertaken prior to implementation.
In addition, significant model and assumption changes are subject to the
periodic reviews and approval by Citi’s U.S. banking regulators.
Citi uses the same independently validated VAR model for both Regulatory
VAR and Risk Management VAR (i.e., Total trading and Total trading and
credit portfolios VARs) and, as such, the model review and oversight process
for both purposes is as described above.
Regulatory VAR, which is calculated in accordance with Basel III, differs
from Risk Management VAR due to the fact that certain positions included
in Risk Management VAR are not eligible for market risk treatment in
Regulatory VAR. The composition of Risk Management VAR is discussed
under “Value at Risk” above. The applicability of the VAR model for positions
eligible for market risk treatment under U.S. regulatory capital rules is
periodically reviewed and approved by Citi’s U.S. banking regulators.
In accordance with Basel III, Regulatory VAR includes all trading book
covered positions and all foreign exchange and commodity exposures.
Pursuant to Basel III, Regulatory VAR excludes positions that fail to meet
the intent and ability to trade requirements and are therefore classified as
non-trading book and categories of exposures that are specifically excluded
as covered positions. Regulatory VAR excludes CVA on derivative instruments
and DVA on Citi’s own fair value option liabilities. CVA hedges are excluded
from Regulatory VAR and included in credit risk-weighted assets as computed
under the Advanced Approaches for determining risk-weighted assets.
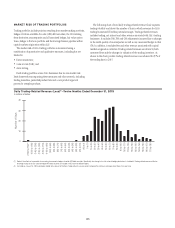
Regulatory VAR Back-testing
In accordance with Basel III, Citi is required to perform back-testing to
evaluate the effectiveness of its Regulatory VAR model. Regulatory VAR back-
testing is the process in which the daily one-day VAR, at a 99% confidence
interval, is compared to the buy-and-hold profit and loss (i.e., the profit and
loss impact if the portfolio is held constant at the end of the day and re-priced
the following day). Buy-and-hold profit and loss represents the daily mark-
to-market profit and loss attributable to price movements in covered positions
from the close of the previous business day. Buy-and-hold profit and loss
excludes realized trading revenue, net interest, fees and commissions, intra-
day trading profit and loss, and changes in reserves.
Based on a 99% confidence level, Citi would expect two to three days in
any one year where buy-and-hold losses exceeded the Regulatory VAR. Given
the conservative calibration of Citi’s VAR model (as a result of taking the
greater of short- and long-term volatilities and fat-tail scaling of volatilities),
Citi would expect fewer exceptions under normal and stable market
conditions. Periods of unstable market conditions could increase the number
of back-testing exceptions.