Citibank 2015 Annual Report Download - page 101
Download and view the complete annual report
Please find page 101 of the 2015 Citibank annual report below. You can navigate through the pages in the report by either clicking on the pages listed below, or by using the keyword search tool below to find specific information within the annual report.-
 1
1 -
2
-
3
-
4
-
5
-
6
-
7
-
8
-
9
-
10
-
11
-
12
-
13
-
14
-
15
-
16
-
17
-
18
-
19
-
20
-
21
-
22
-
23
-
24
-
25
-
26
-
27
-
28
-
29
-
30
-
31
-
32
-
33
-
34
-
35
-
36
-
37
-
38
-
39
-
40
-
41
-
42
-
43
-
44
-
45
-
46
-
47
-
48
-
49
-
50
-
51
-
52
-
53
-
54
-
55
-
56
-
57
-
58
-
59
-
60
-
61
-
62
-
63
-
64
-
65
-
66
-
67
-
68
-
69
-
70
-
71
-
72
-
73
-
74
-
75
-
76
-
77
-
78
-
79
-
80
-
81
-
82
-
83
-
84
-
85
-
86
-
87
-
88
-
89
-
90
-
 91
91 -
 92
92 -
 93
93 -
 94
94 -
 95
95 -
 96
96 -
 97
97 -
 98
98 -
 99
99 -
 100
100 -
 101
101 -
 102
102 -
 103
103 -
 104
104 -
 105
105 -
 106
106 -
 107
107 -
 108
108 -
 109
109 -
 110
110 -
 111
111 -
112
-
113
-
114
-
115
-
116
-
117
-
118
-
119
-
120
-
121
-
122
-
123
-
124
-
125
-
126
-
127
-
128
-
129
-
130
-
131
-
132
-
133
-
134
-
135
-
136
-
137
-
138
-
139
-
140
-
141
-
142
-
143
-
144
-
145
-
146
-
147
-
148
-
149
-
150
-
151
-
152
-
153
-
154
-
155
-
156
-
157
-
158
-
159
-
160
-
161
-
162
-
163
-
164
-
165
-
166
-
167
-
168
-
169
-
170
-
171
-
172
-
173
-
174
-
175
-
176
-
177
-
178
-
179
-
180
-
181
-
182
-
183
-
184
-
185
-
186
-
187
-
188
-
189
-
190
-
191
-
192
-
193
-
194
-
195
-
196
-
197
-
198
-
199
-
200
-
201
-
202
-
203
-
204
-
205
-
206
-
207
-
208
-
209
-
210
-
211
-
212
-
213
-
214
-
215
-
216
-
217
-
218
-
219
-
220
-
221
-
222
-
223
-
224
-
225
-
226
-
227
-
228
-
229
-
230
-
231
-
232
-
233
-
234
-
235
-
236
-
237
-
238
-
239
-
240
-
241
-
242
-
243
-
244
-
245
-
246
-
247
-
248
-
249
-
250
-
251
-
252
-
253
-
254
-
255
-
256
-
257
-
258
-
259
-
260
-
261
-
262
-
263
-
264
-
265
-
266
-
267
-
268
-
269
-
270
-
271
-
272
-
273
-
274
-
275
-
276
-
277
-
278
-
279
-
280
-
281
-
282
-
283
-
284
-
285
-
286
-
287
-
288
-
289
-
290
-
291
-
292
-
293
-
294
-
295
-
296
-
297
-
298
-
299
-
300
-
301
-
302
-
303
-
304
-
305
-
306
-
307
-
308
-
309
-
310
-
311
-
312
-
313
-
314
-
315
-
316
-
317
-
318
-
319
-
320
-
321
-
322
-
323
-
324
-
325
-
326
-
327
-
328
-
329
-
330
-
331
-
332
 |
 |

83
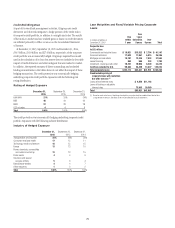
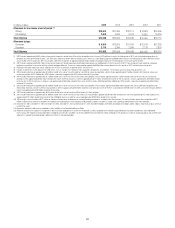
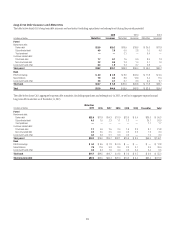
Allowance for Loan Losses
The following tables detail information on Citi’s allowance for loan losses, loans and coverage ratios:
December 31, 2015
In billions of dollars Allowance for loan losses Loans, net of unearned income Allowance as a percentage of loans (1)
North America cards (2) $ 4.5 $ 113.4 4.0%
North America mortgages (3)(4) 1.7 79.6 2.1
North America other 0.5 12.6 4.0
International cards 1.6 26.7 6.0
International other (5) 1.6 97.5 1.6
Total consumer $ 9.9 $329.8 3.0%
Total corporate 2.7 287.8 1.0
Total Citigroup $12.6 $617.6 2.0%
(1) Allowance as a percentage of loans excludes loans that are carried at fair value.
(2) Includes both Citi-branded cards and Citi retail services. The $4.5 billion of loan loss reserves represented approximately 15 months of coincident net credit loss coverage.
(3) Of the $1.7 billion, approximately $1.6 billion was allocated to North America mortgages in Citi Holdings. The $1.7 billion of loan loss reserves represented approximately 97 months of coincident net credit loss
coverage (for both total North America mortgages and Citi Holdings North America mortgages), excluding the HFS portfolios. The increased months of coverage from December 31, 2014 was primarily due to the high
percentage of troubled debt restructuring (TDR) loans and related Allowance for loan losses, as well as the transfer of certain consumer mortgages and related Allowance for loan losses to HFS during the fourth quarter
of 2015.
(4) Of the $1.7 billion in loan loss reserves, approximately $0.6 billion and $1.1 billion are determined in accordance with ASC 450-20 and ASC 310-10-35 (troubled debt restructurings), respectively. Of the $79.6 billion
in loans, approximately $72.3 billion and $7.1 billion of the loans are evaluated in accordance with ASC 450-20 and ASC 310-10-35 (troubled debt restructurings), respectively. For additional information, see Note 16
to the Consolidated Financial Statements.
(5) Includes mortgages and other retail loans.
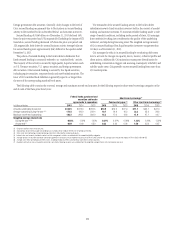
December 31, 2014
In billions of dollars Allowance for loan losses Loans, net of unearned income Allowance as a percentage of loans (1)
North America cards (2) $4.9 $114.0 4.3%
North America mortgages (3)(4) 3.7 95.9 3.9
North America other 1.2 21.6 5.6
International cards 1.9 31.5 6.0
International other (5) 1.9 106.9 1.8
Total consumer $13.6 $ 369.9 3.7%
Total corporate 2.4 274.7 0.9
Total Citigroup $16.0 $ 644.6 2.5%
(1) Allowance as a percentage of loans excludes loans that are carried at fair value.
(2) Includes both Citi-branded cards and Citi retail services. The $4.9 billion of loan loss reserves represented approximately 15 months of coincident net credit loss coverage.
(3) Of the $3.7 billion, approximately $3.5 billion was allocated to North America mortgages in Citi Holdings. The $3.7 billion of loan loss reserves represented approximately 53 months of coincident net credit loss
coverage (for both total North America mortgages and Citi Holdings North America mortgages).
(4) Of the $3.7 billion in loan loss reserves, approximately $1.2 billion and $2.5 billion are determined in accordance with ASC 450-20 and ASC 310-10-35 (troubled debt restructurings), respectively. Of the $95.9 billion
in loans, approximately $80.4 billion and $15.2 billion of the loans are evaluated in accordance with ASC 450-20 and ASC 310-10-35 (troubled debt restructurings), respectively. For additional information, see Note 16
to the Consolidated Financial Statements.
(5) Includes mortgages and other retail loans.