Citibank 2015 Annual Report Download - page 42
Download and view the complete annual report
Please find page 42 of the 2015 Citibank annual report below. You can navigate through the pages in the report by either clicking on the pages listed below, or by using the keyword search tool below to find specific information within the annual report.-
 1
1 -
2
-
3
-
4
-
5
-
6
-
7
-
8
-
9
-
10
-
11
-
12
-
13
-
14
-
15
-
16
-
17
-
18
-
19
-
20
-
21
-
22
-
23
-
24
-
25
-
26
-
27
-
28
-
29
-
30
-
31
-
 32
32 -
 33
33 -
 34
34 -
 35
35 -
 36
36 -
 37
37 -
 38
38 -
 39
39 -
 40
40 -
 41
41 -
 42
42 -
 43
43 -
 44
44 -
 45
45 -
 46
46 -
 47
47 -
 48
48 -
 49
49 -
 50
50 -
 51
51 -
 52
52 -
53
-
54
-
55
-
56
-
57
-
58
-
59
-
60
-
61
-
62
-
63
-
64
-
65
-
66
-
67
-
68
-
69
-
70
-
71
-
72
-
73
-
74
-
75
-
76
-
77
-
78
-
79
-
80
-
81
-
82
-
83
-
84
-
85
-
86
-
87
-
88
-
89
-
90
-
91
-
92
-
93
-
94
-
95
-
96
-
97
-
98
-
99
-
100
-
101
-
102
-
103
-
104
-
105
-
106
-
107
-
108
-
109
-
110
-
111
-
112
-
113
-
114
-
115
-
116
-
117
-
118
-
119
-
120
-
121
-
122
-
123
-
124
-
125
-
126
-
127
-
128
-
129
-
130
-
131
-
132
-
133
-
134
-
135
-
136
-
137
-
138
-
139
-
140
-
141
-
142
-
143
-
144
-
145
-
146
-
147
-
148
-
149
-
150
-
151
-
152
-
153
-
154
-
155
-
156
-
157
-
158
-
159
-
160
-
161
-
162
-
163
-
164
-
165
-
166
-
167
-
168
-
169
-
170
-
171
-
172
-
173
-
174
-
175
-
176
-
177
-
178
-
179
-
180
-
181
-
182
-
183
-
184
-
185
-
186
-
187
-
188
-
189
-
190
-
191
-
192
-
193
-
194
-
195
-
196
-
197
-
198
-
199
-
200
-
201
-
202
-
203
-
204
-
205
-
206
-
207
-
208
-
209
-
210
-
211
-
212
-
213
-
214
-
215
-
216
-
217
-
218
-
219
-
220
-
221
-
222
-
223
-
224
-
225
-
226
-
227
-
228
-
229
-
230
-
231
-
232
-
233
-
234
-
235
-
236
-
237
-
238
-
239
-
240
-
241
-
242
-
243
-
244
-
245
-
246
-
247
-
248
-
249
-
250
-
251
-
252
-
253
-
254
-
255
-
256
-
257
-
258
-
259
-
260
-
261
-
262
-
263
-
264
-
265
-
266
-
267
-
268
-
269
-
270
-
271
-
272
-
273
-
274
-
275
-
276
-
277
-
278
-
279
-
280
-
281
-
282
-
283
-
284
-
285
-
286
-
287
-
288
-
289
-
290
-
291
-
292
-
293
-
294
-
295
-
296
-
297
-
298
-
299
-
300
-
301
-
302
-
303
-
304
-
305
-
306
-
307
-
308
-
309
-
310
-
311
-
312
-
313
-
314
-
315
-
316
-
317
-
318
-
319
-
320
-
321
-
322
-
323
-
324
-
325
-
326
-
327
-
328
-
329
-
330
-
331
-
332
 |
 |

24
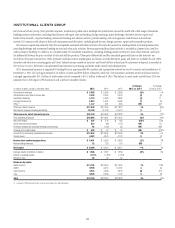
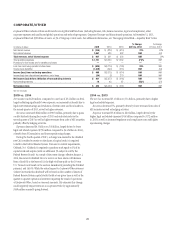
INSTITUTIONAL CLIENTS GROUP
Institutional Clients Group (ICG) provides corporate, institutional, public sector and high-net-worth clients around the world with a full range of wholesale
banking products and services, including fixed income and equity sales and trading, foreign exchange, prime brokerage, derivative services, equity and
fixed income research, corporate lending, investment banking and advisory services, private banking, cash management, trade finance and securities
services. ICG transacts with clients in both cash instruments and derivatives, including fixed income, foreign currency, equity and commodity products.
ICG revenue is generated primarily from fees and spreads associated with these activities. ICG earns fee income for assisting clients in clearing transactions,
providing brokerage and investment banking services and other such activities. Revenue generated from these activities is recorded in Commissions and fees
and Investment banking. In addition, as a market maker, ICG facilitates transactions, including holding product inventory to meet client demand, and earns
the differential between the price at which it buys and sells the products. These price differentials and the unrealized gains and losses on the inventory are
recorded in Principal transactions. Other primarily includes mark-to-market gains and losses on credit derivatives, gains and losses on available-for-sale (AFS)
securities and other non-recurring gains and losses. Interest income earned on inventory and loans held less interest paid to customers on deposits is recorded as
Net interest revenue. Revenue is also generated from transaction processing and assets under custody and administration.
ICG’s international presence is supported by trading floors in approximately 80 countries and a proprietary network in over 95 countries and jurisdictions. At
December 31, 2015, ICG had approximately $1.2 trillion of assets and $587 billion of deposits, while two of its businesses, securities services and issuer services,
managed approximately $15.1 trillion of assets under custody compared to $16.1 trillion at the end of 2014. The decline in assets under custody from 2014 was
primarily due to the impact of FX translation and a decline in market volumes.
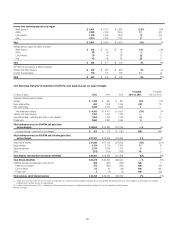
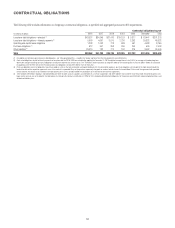
In millions of dollars, except as otherwise noted 2015 2014 2013
% Change
2015 vs. 2014
% Change
2014 vs. 2013
Commissions and fees $ 3,855 $ 3,995 $ 3,980 (4)% —%
Administration and other fiduciary fees 2,424 2,520 2,576 (4) (2)
Investment banking 4,110 4,269 3,862 (4) 11
Principal transactions 5,823 5,905 6,489 (1) (9)
Other (1) 1,337 661 905 NM (27)
Total non-interest revenue $ 17,549 $ 17,350 $ 17,812 1% (3)%
Net interest revenue (including dividends) 16,199 15,702 15,510 31
Total revenues, net of interest expense $ 33,748 $ 33,052 $ 33,322 2% (1)%
Total operating expenses $ 18,985 $ 19,391 $ 19,645 (2)% (1)%
Net credit losses $ 207 $ 276 $ 182 (25)% 52%
Credit reserve build (release) 627 (90) (157) NM 43
Provision (release) for unfunded lending commitments 95 (129) 53 NM NM
Provisions for credit losses $ 929 $ 57 $ 78 NM (27)%
Income from continuing operations before taxes $ 13,834 $ 13,604 $ 13,599 2% —%
Income taxes 4,383 4,070 4,174 8(2)
Income from continuing operations $ 9,451 $ 9,534 $ 9,425 (1)% 1%
Noncontrolling interests 52 118 110 (56) 7
Net income $ 9,399 $ 9,416 $ 9,315 —% 1%
Average assets (in billions of dollars) $ 1,266 $ 1,287 $ 1,258 (2)% 2%
Return on average assets 0.74% 0.73% 0.74%
Efficiency ratio 56 59 59
Revenues by region
North America $ 13,105 $ 12,940 $ 11,434 1% 13%
EMEA 9,799 9,415 10,061 4(6)
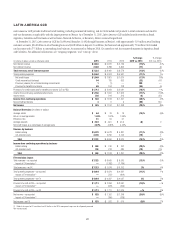
Latin America 3,918 4,098 4,675 (4) (12)
Asia 6,926 6,599 7,152 5(8)
Total $ 33,748 $ 33,052 $ 33,322 2% (1)%
(1) Increase in 2015 primarily reflects mark-to-market gains on credit derivatives.