Citibank 2015 Annual Report Download - page 270
Download and view the complete annual report
Please find page 270 of the 2015 Citibank annual report below. You can navigate through the pages in the report by either clicking on the pages listed below, or by using the keyword search tool below to find specific information within the annual report.-
 1
1 -
2
-
3
-
4
-
5
-
6
-
7
-
8
-
9
-
10
-
11
-
12
-
13
-
14
-
15
-
16
-
17
-
18
-
19
-
20
-
21
-
22
-
23
-
24
-
25
-
26
-
27
-
28
-
29
-
30
-
31
-
32
-
33
-
34
-
35
-
36
-
37
-
38
-
39
-
40
-
41
-
42
-
43
-
44
-
45
-
46
-
47
-
48
-
49
-
50
-
51
-
52
-
53
-
54
-
55
-
56
-
57
-
58
-
59
-
60
-
61
-
62
-
63
-
64
-
65
-
66
-
67
-
68
-
69
-
70
-
71
-
72
-
73
-
74
-
75
-
76
-
77
-
78
-
79
-
80
-
81
-
82
-
83
-
84
-
85
-
86
-
87
-
88
-
89
-
90
-
91
-
92
-
93
-
94
-
95
-
96
-
97
-
98
-
99
-
100
-
101
-
102
-
103
-
104
-
105
-
106
-
107
-
108
-
109
-
110
-
111
-
112
-
113
-
114
-
115
-
116
-
117
-
118
-
119
-
120
-
121
-
122
-
123
-
124
-
125
-
126
-
127
-
128
-
129
-
130
-
131
-
132
-
133
-
134
-
135
-
136
-
137
-
138
-
139
-
140
-
141
-
142
-
143
-
144
-
145
-
146
-
147
-
148
-
149
-
150
-
151
-
152
-
153
-
154
-
155
-
156
-
157
-
158
-
159
-
160
-
161
-
162
-
163
-
164
-
165
-
166
-
167
-
168
-
169
-
170
-
171
-
172
-
173
-
174
-
175
-
176
-
177
-
178
-
179
-
180
-
181
-
182
-
183
-
184
-
185
-
186
-
187
-
188
-
189
-
190
-
191
-
192
-
193
-
194
-
195
-
196
-
197
-
198
-
199
-
200
-
201
-
202
-
203
-
204
-
205
-
206
-
207
-
208
-
209
-
210
-
211
-
212
-
213
-
214
-
215
-
216
-
217
-
218
-
219
-
220
-
221
-
222
-
223
-
224
-
225
-
226
-
227
-
228
-
229
-
230
-
231
-
232
-
233
-
234
-
235
-
236
-
237
-
238
-
239
-
240
-
241
-
242
-
243
-
244
-
245
-
246
-
247
-
248
-
249
-
250
-
251
-
252
-
253
-
254
-
255
-
256
-
257
-
258
-
259
-
 260
260 -
 261
261 -
 262
262 -
 263
263 -
 264
264 -
 265
265 -
 266
266 -
 267
267 -
 268
268 -
 269
269 -
 270
270 -
 271
271 -
 272
272 -
 273
273 -
 274
274 -
 275
275 -
 276
276 -
 277
277 -
 278
278 -
 279
279 -
 280
280 -
281
-
282
-
283
-
284
-
285
-
286
-
287
-
288
-
289
-
290
-
291
-
292
-
293
-
294
-
295
-
296
-
297
-
298
-
299
-
300
-
301
-
302
-
303
-
304
-
305
-
306
-
307
-
308
-
309
-
310
-
311
-
312
-
313
-
314
-
315
-
316
-
317
-
318
-
319
-
320
-
321
-
322
-
323
-
324
-
325
-
326
-
327
-
328
-
329
-
330
-
331
-
332
 |
 |
252
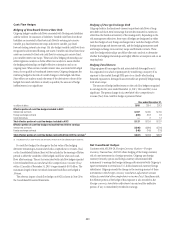
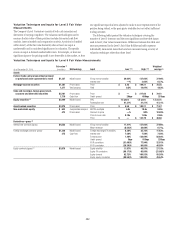
Trading Account Assets and Liabilities—Derivatives
Exchange-traded derivatives, measured at fair value using quoted
(i.e., exchange) prices in active markets, where available, are classified as
Level 1 of the fair value hierarchy.
Derivatives without a quoted price in an active market and derivatives
executed over the counter are valued using internal valuation techniques.
These derivative instruments are classified as either Level 2 or Level 3
depending upon the observability of the significant inputs to the model.
The valuation techniques and inputs depend on the type of derivative
and the nature of the underlying instrument. The principal techniques used
to value these instruments are discounted cash flows and internal models,
including Black-Scholes and Monte Carlo simulation.
The key inputs depend upon the type of derivative and the nature
of the underlying instrument and include interest rate yield curves,
foreign-exchange rates, volatilities and correlation. The Company uses
overnight indexed swap (OIS) curves as fair value measurement inputs
for the valuation of certain collateralized derivatives. Citi uses the relevant
benchmark curve for the currency of the derivative (e.g., the London
Interbank Offered Rate for U.S. dollar derivatives) as the discount rate for
uncollateralized derivatives.
As referenced above, during the third quarter of 2014, Citi incorporated
FVA into the fair value measurements due to what it believes to be an
industry migration toward incorporating the market’s view of funding risk
premium in OTC derivatives. The charge incurred in connection with the
implementation of FVA was reflected in Principal transactions as a change
in accounting estimate. Citi’s FVA methodology leverages the existing
CVA methodology to estimate a funding exposure profile. The calculation
of this exposure profile considers collateral agreements where the terms
do not permit the firm to reuse the collateral received, including where
counterparties post collateral to third-party custodians.
Investments
The investments category includes available-for-sale debt and marketable
equity securities whose fair values are generally determined by utilizing
similar procedures described for trading securities above or, in some cases,
using vendor pricing as the primary source.
Also included in investments are nonpublic investments in private equity
and real estate entities. Determining the fair value of nonpublic securities
involves a significant degree of management judgment, as no quoted prices
exist and such securities are generally thinly traded. In addition, there may
be transfer restrictions on private equity securities. The Company’s process
for determining the fair value of such securities utilizes commonly accepted
valuation techniques, including comparables analysis. In determining the
fair value of nonpublic securities, the Company also considers events such
as a proposed sale of the investee company, initial public offerings, equity
issuances or other observable transactions.
Private equity securities are generally classified as Level 3 of the fair
value hierarchy.
In addition, the Company holds investments in certain alternative
investment funds that calculate NAV per share, including hedge funds,
private equity funds and real estate funds. Investments in funds are generally
classified as non-marketable equity securities carried at fair value. The fair
values of these investments are estimated using the NAV per share of the
Company’s ownership interest in the funds where it is not probable that the
investment will be realized at a price other than the NAV. Consistent with the
provisions of ASU No. 2015-07 these investments have not been categorized
within the fair value hierarchy and are not included in the tables below. See
Note 13 to the Consolidated Financial Statements for additional information.